FeatureTransformer
Generated feature transformations
Description
A FeatureTransformer object contains information about the
feature transformations generated from a training data set. To better understand the generated
features, you can use the describe object
function. To apply the same training set feature transformations to a test set, you can use
the transform object
function.
Creation
Create a FeatureTransformer object by using the gencfeatures or
genrfeatures
function.
Properties
Object Functions
Examples
Generate features from a table of predictor data by using genrfeatures. Inspect the generated features by using the describe object function.
Read power outage data into the workspace as a table. Remove observations with missing values, and display the first few rows of the table.
outages = readtable("outages.csv");
Tbl = rmmissing(outages);
head(Tbl)
Region OutageTime Loss Customers RestorationTime Cause
_____________ ________________ ______ __________ ________________ ___________________
{'SouthWest'} 2002-02-01 12:18 458.98 1.8202e+06 2002-02-07 16:50 {'winter storm' }
{'SouthEast'} 2003-02-07 21:15 289.4 1.4294e+05 2003-02-17 08:14 {'winter storm' }
{'West' } 2004-04-06 05:44 434.81 3.4037e+05 2004-04-06 06:10 {'equipment fault'}
{'MidWest' } 2002-03-16 06:18 186.44 2.1275e+05 2002-03-18 23:23 {'severe storm' }
{'West' } 2003-06-18 02:49 0 0 2003-06-18 10:54 {'attack' }
{'NorthEast'} 2003-07-16 16:23 239.93 49434 2003-07-17 01:12 {'fire' }
{'MidWest' } 2004-09-27 11:09 286.72 66104 2004-09-27 16:37 {'equipment fault'}
{'SouthEast'} 2004-09-05 17:48 73.387 36073 2004-09-05 20:46 {'equipment fault'}
Some of the variables, such as OutageTime and RestorationTime, have data types that are not supported by regression model training functions like fitrensemble.
Generate 25 features from the predictors in Tbl that can be used to train a bagged ensemble. Specify the Loss table variable as the response.
rng("default") % For reproducibility
Transformer = genrfeatures(Tbl,"Loss",25,TargetLearner="bag")
Transformer =
  FeatureTransformer with properties:

                     Type: 'regression'
            TargetLearner: 'bag'
    NumEngineeredFeatures: 22
      NumOriginalFeatures: 3
         TotalNumFeatures: 25
The Transformer object contains the information about the generated features and the transformations used to create them.
To better understand the generated features, use the describe object function.
Info = describe(Transformer)
Info=25×4 table
                                     Type        IsOriginal          InputVariables                                     Transformations
                                  ___________    __________    ___________________________    ___________________________________________________________________

    c(Region)                     Categorical      true        Region                         "Variable of type categorical converted from a cell data type"
    Customers                     Numeric          true        Customers                      ""
    c(Cause)                      Categorical      true        Cause                          "Variable of type categorical converted from a cell data type"
    kmd2                          Numeric          false       Customers                      "Euclidean distance to centroid 2 (kmeans clustering with k = 10)"
    kmd1                          Numeric          false       Customers                      "Euclidean distance to centroid 1 (kmeans clustering with k = 10)"
    kmd4                          Numeric          false       Customers                      "Euclidean distance to centroid 4 (kmeans clustering with k = 10)"
    kmd5                          Numeric          false       Customers                      "Euclidean distance to centroid 5 (kmeans clustering with k = 10)"
    kmd9                          Numeric          false       Customers                      "Euclidean distance to centroid 9 (kmeans clustering with k = 10)"
    cos(Customers)                Numeric          false       Customers                      "cos( )"
    RestorationTime-OutageTime    Numeric          false       OutageTime, RestorationTime    "Elapsed time in seconds between OutageTime and RestorationTime"
    kmd6                          Numeric          false       Customers                      "Euclidean distance to centroid 6 (kmeans clustering with k = 10)"
    kmi                           Categorical      false       Customers                      "Cluster index encoding (kmeans clustering with k = 10)"
    kmd7                          Numeric          false       Customers                      "Euclidean distance to centroid 7 (kmeans clustering with k = 10)"
    kmd3                          Numeric          false       Customers                      "Euclidean distance to centroid 3 (kmeans clustering with k = 10)"
    kmd10                         Numeric          false       Customers                      "Euclidean distance to centroid 10 (kmeans clustering with k = 10)"
    hour(RestorationTime)         Numeric          false       RestorationTime                "Hour of the day"
      ⋮
The first three generated features are original to Tbl, although the software converts the original Region and Cause variables to categorical variables.
Info(1:3,:) % describe(Transformer,1:3)ans=3×4 table
Type IsOriginal InputVariables Transformations
___________ __________ ______________ ______________________________________________________________
c(Region) Categorical true Region "Variable of type categorical converted from a cell data type"
Customers Numeric true Customers ""
c(Cause) Categorical true Cause "Variable of type categorical converted from a cell data type"
The OutageTime and RestorationTime variables are not included as generated features because they are datetime variables, which cannot be used to train a bagged ensemble model. However, the software derives some generated features from these variables, such as the tenth feature RestorationTime-OutageTime.
Info(10,:) % describe(Transformer,10)ans=1×4 table
Type IsOriginal InputVariables Transformations
_______ __________ ___________________________ ________________________________________________________________
RestorationTime-OutageTime Numeric false OutageTime, RestorationTime "Elapsed time in seconds between OutageTime and RestorationTime"
Some generated features are a combination of multiple transformations. For example, the software generates the nineteenth feature fenc(c(Cause)) by converting the Cause variable to a categorical variable with 10 categories and then calculating the frequency of the categories.
Info(19,:) % describe(Transformer,19)ans=1×4 table
Type IsOriginal InputVariables Transformations
_______ __________ ______________ ____________________________________________________________________________________________________________
fenc(c(Cause)) Numeric false Cause "Variable of type categorical converted from a cell data type -> Frequency encoding (number of levels = 10)"
Train a linear classifier using only the numeric generated features returned by gencfeatures.
Load the patients data set. Create a table from a subset of the variables.
load patients
Tbl = table(Age,Diastolic,Height,SelfAssessedHealthStatus, ...
    Smoker,Systolic,Weight,Gender);
Partition the data into training and test sets. Use approximately 70% of the observations as training data, and 30% of the observations as test data. Partition the data using cvpartition.
rng("default")
c = cvpartition(Tbl.Gender,Holdout=0.30);
TrainTbl = Tbl(training(c),:);
TestTbl = Tbl(test(c),:);
Use the training data to generate 25 new features. Specify the minimum redundancy maximum relevance (MRMR) feature selection method for selecting new features.
Transformer = gencfeatures(TrainTbl,"Gender",25, ...
    FeatureSelectionMethod="mrmr")
Transformer =
  FeatureTransformer with properties:

                     Type: 'classification'
            TargetLearner: 'linear'
    NumEngineeredFeatures: 23
      NumOriginalFeatures: 2
         TotalNumFeatures: 25
Inspect the generated features.
Info = describe(Transformer)
Info=25×4 table
                                      Type        IsOriginal         InputVariables                                              Transformations
                                   ___________    __________    ________________________    __________________________________________________________________________________________

    zsc(Weight)                    Numeric          true        Weight                      "Standardization with z-score (mean = 153.1571, std = 26.8229)"
    eb5(Weight)                    Categorical      false       Weight                      "Equal-width binning (number of bins = 5)"
    c(SelfAssessedHealthStatus)    Categorical      true        SelfAssessedHealthStatus    "Variable of type categorical converted from a cell data type"
    zsc(sqrt(Systolic))            Numeric          false       Systolic                    "sqrt( ) -> Standardization with z-score (mean = 11.086, std = 0.29694)"
    zsc(sin(Systolic))             Numeric          false       Systolic                    "sin( ) -> Standardization with z-score (mean = -0.1303, std = 0.72575)"
    zsc(Systolic./Weight)          Numeric          false       Systolic, Weight            "Systolic ./ Weight -> Standardization with z-score (mean = 0.82662, std = 0.14555)"
    zsc(Age+Weight)                Numeric          false       Age, Weight                 "Age + Weight -> Standardization with z-score (mean = 191.1143, std = 28.6976)"
    zsc(Age./Weight)               Numeric          false       Age, Weight                 "Age ./ Weight -> Standardization with z-score (mean = 0.25424, std = 0.062486)"
    zsc(Diastolic.*Weight)         Numeric          false       Diastolic, Weight           "Diastolic .* Weight -> Standardization with z-score (mean = 12864.6857, std = 2731.1613)"
    q6(Height)                     Categorical      false       Height                      "Equiprobable binning (number of bins = 6)"
    zsc(Systolic+Weight)           Numeric          false       Systolic, Weight            "Systolic + Weight -> Standardization with z-score (mean = 276.1429, std = 28.7111)"
    zsc(Diastolic-Weight)          Numeric          false       Diastolic, Weight           "Diastolic - Weight -> Standardization with z-score (mean = -69.4286, std = 26.2411)"
    zsc(Age-Weight)                Numeric          false       Age, Weight                 "Age - Weight -> Standardization with z-score (mean = -115.2, std = 27.0113)"
    zsc(Height./Weight)            Numeric          false       Height, Weight              "Height ./ Weight -> Standardization with z-score (mean = 0.44797, std = 0.067992)"
    zsc(Height.*Weight)            Numeric          false       Height, Weight              "Height .* Weight -> Standardization with z-score (mean = 10291.0714, std = 2111.9071)"
    zsc(Diastolic+Weight)          Numeric          false       Diastolic, Weight           "Diastolic + Weight -> Standardization with z-score (mean = 236.8857, std = 29.2439)"
      ⋮
Transform the training and test sets, but retain only the numeric predictors.
numericIdx = (Info.Type == "Numeric");
NewTrainTbl = transform(Transformer,TrainTbl,numericIdx);
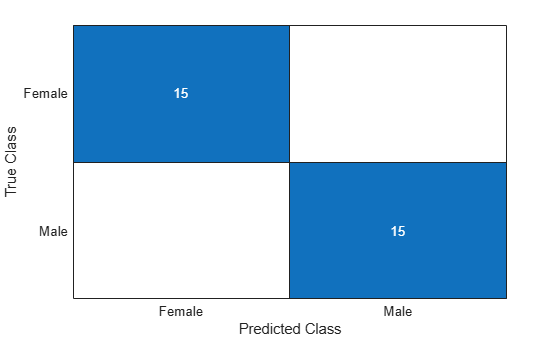
NewTestTbl = transform(Transformer,TestTbl,numericIdx);Train a linear model using the transformed training data. Visualize the accuracy of the model's test set predictions by using a confusion matrix.
Mdl = fitclinear(NewTrainTbl,TrainTbl.Gender);
testLabels = predict(Mdl,NewTestTbl);
confusionchart(TestTbl.Gender,testLabels)
Version History
Introduced in R2021a