mnrnd
Multinomial random numbers
Description
Examples
Suppose that you select 100 balls at random from a bin where 20% of the balls are red, 30% are blue, and 50% are green. After each selection, you return the ball to the bin. Generate a single random vector from the multinomial distribution that represents the number of balls drawn of each color.
rng(0,"twister") % For reproducibility r = mnrnd(100,[0.2 0.3 0.5])
r = 1×3
20 26 54
The random vector indicates that 20 red balls, 26 blue balls, and 54 green balls were drawn.
Define multinomial probability distributions for three different processes, where each process has four possible outcomes.
P = [1/4 1/4 1/8 3/8; 1/10 2/10 3/10 2/5; 1/5 1/5 1/5 2/5];
Each row of P contains the outcome probabilities for each process.
Generate a set of random vectors for 100 independent trials of each process.
rng(0,"twister") % For reproducibility R = mnrnd(100,P)
R = 3×4
22 24 10 44
11 24 30 35
16 22 24 38
Each row of R corresponds to a process, and each column contains the number of instances of a particular outcome.
Generate 50 random vectors from a multinomial distribution with 30 trials and the probability 0.2 for the first outcome, 0.4 for the second outcome, and 0.4 for the third outcome.
rng(0,"twister") % For reproducibility m = 50; n = 30; p = [0.2 0.4 0.4]; Y = mnrnd(n,p,m);
Create a 3-D plot of the random vectors. Add a drop-down line from each marker and add a plane defined by x + y + z = n.
scatter3(Y(:,1),Y(:,2),Y(:,3),"filled") xlabel("n1") ylabel("n2") zlabel("n3") hold on % Add drop-down lines for i = 1:m plot3([Y(i,1) Y(i,1)],[Y(i,2) Y(i,2)],[0 Y(i,3)],"k:") end xlim([0 n]) ylim([0 n]) zlim([0 n]) % Add a plane [x,y] = meshgrid(0:2:n, 0:2:n); z = n - x - y; surf(x,y,z,FaceColor="interp",EdgeColor="interp",FaceAlpha=0.2) hold off view([-155 30])

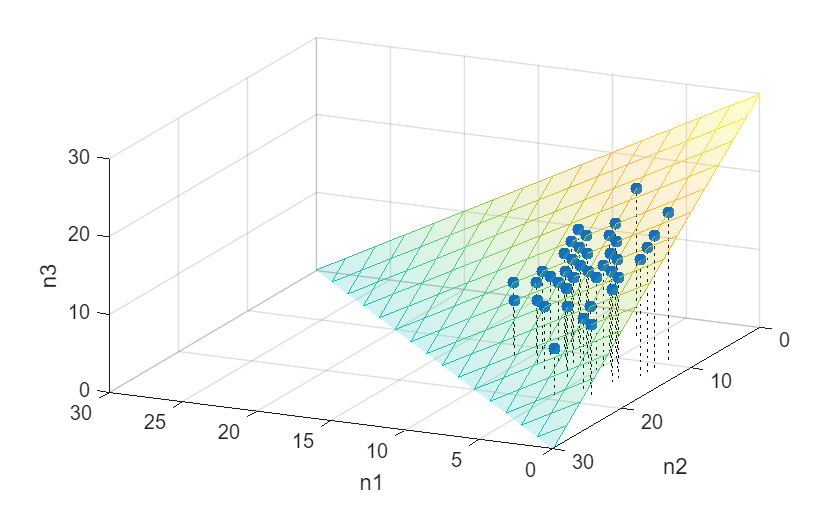
The coordinates of the plot markers correspond to the frequency of each outcome in an experiment with 30 trials. For example, the marker at [6, 8, 16] represents an experiment with 6 instances of outcome 1, 8 instances of outcome 2, and 16 instances of outcome 3. All of the markers lie in the plane defined by n1 + n2 + n3 = n. Because outcome 1 has the lowest probability, the markers are concentrated on the right side of the plot.
Input Arguments
Number of trials for each multinomial outcome, specified as a positive integer or a column vector of positive integers.
If you specify m, then n must be a
positive integer.
If you do not specify m, and P is a
j-by-k matrix with at least two rows:
mnrndreplicatesnto a j-by-1 vector whennis a positive integer.nmust have j elements when it is a column vector.
Data Types: single | double
Outcome probabilities, specified as one of the following, where k
is the number of multinomial bins (or categories) and P must
contain only nonnegative scalar values:
k-by-1 vector that sums to 1. In this case,
mnrndtransposesPinto a 1-by-k vector.1-by-k vector. If
nis a column vector, thenmnrndreplicatesPinto a matrix with the same number of rows asn.j-by-k matrix, where each row corresponds to a multinomial probability distribution. If
nis a column vector, thenPandnmust have the same number of rows. If you specifym, you cannot specifyPas a matrix.
If a row of P does not sum to 1, the corresponding row in
R is NaN.
Data Types: single | double
Output Arguments
Multinomial random vectors, returned as a numeric matrix with the same number of
columns as P.
If
nis a positive integer andPis a row vector, thenRcontainsmrows. If you do not specifym, thenRcontains only one row. Each row ofRcontains a vector drawn from the multinomial distribution defined bynandP.If
nis a j-by-1 vector orPis a j-by-k matrix, thenRcontainsjrows. Each row ofRcontains a vector drawn from the multinomial distribution defined by the corresponding rows ofnandP.If a row of
Pdoes not sum to 1, the corresponding row inRisNaN.
Version History
Introduced in R2006b
MATLAB Command
You clicked a link that corresponds to this MATLAB command:
Run the command by entering it in the MATLAB Command Window. Web browsers do not support MATLAB commands.
Sélectionner un site web
Choisissez un site web pour accéder au contenu traduit dans votre langue (lorsqu'il est disponible) et voir les événements et les offres locales. D’après votre position, nous vous recommandons de sélectionner la région suivante : .
Vous pouvez également sélectionner un site web dans la liste suivante :
Comment optimiser les performances du site
Pour optimiser les performances du site, sélectionnez la région Chine (en chinois ou en anglais). Les sites de MathWorks pour les autres pays ne sont pas optimisés pour les visites provenant de votre région.
Amériques
- América Latina (Español)
- Canada (English)
- United States (English)
Europe
- Belgium (English)
- Denmark (English)
- Deutschland (Deutsch)
- España (Español)
- Finland (English)
- France (Français)
- Ireland (English)
- Italia (Italiano)
- Luxembourg (English)
- Netherlands (English)
- Norway (English)
- Österreich (Deutsch)
- Portugal (English)
- Sweden (English)
- Switzerland
- United Kingdom (English)