normspec
Normal density plot shading between specifications
Syntax
Description
p = normspec(specs)specs, and returns the
probability p of the shaded area. If spec has
no lower limit, then set specs(1) to –Inf; if
spec has no upper limit, then set specs(2)
to Inf.
[
also returns a column vector of chart line objects p,h] = normspec(___)h. Use
h to modify properties of a specific chart line after you
create the chart. For a list of properties, see Line Properties.
Examples
Create a standard normal density plot, shading the portion inside the specification limits [-1,1].
p = normspec([-1,1])
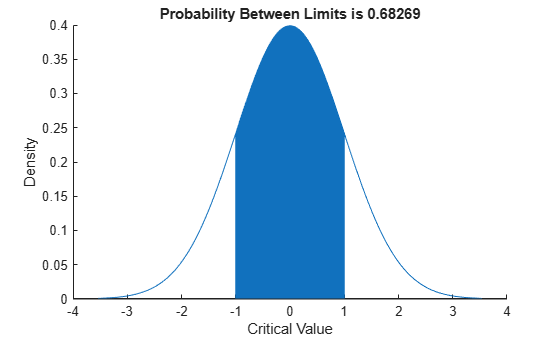
p =
0.6827
Create a normal density plot, shading the portion outside the specification limits.
For example, consider a production process that fills cans of paint. The average amount of paint in any can is 1 gallon, but variability in the process produces a standard deviation of 2 ounces (2/128 gallons). Create a normal density plot, shading the portion corresponding to the probability that the cans will be filled under specification by 3 or more ounces.
p = normspec([1-3/128,Inf],1,2/128,'outside')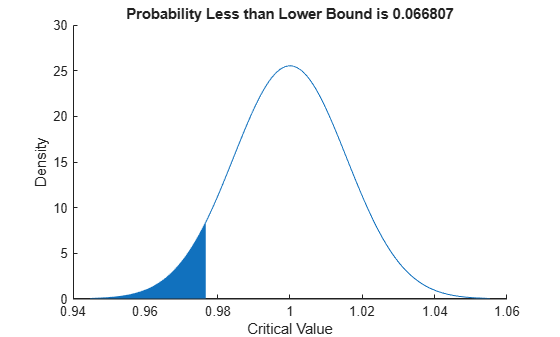
p =
0.0668