ezpolar
(Not recommended) Polar coordinate plotter
ezpolar is not recommended. Use fpolarplot
instead.
Description
Examples
Create a polar plot of the function over the domain .
syms t
ezpolar(1 + cos(t))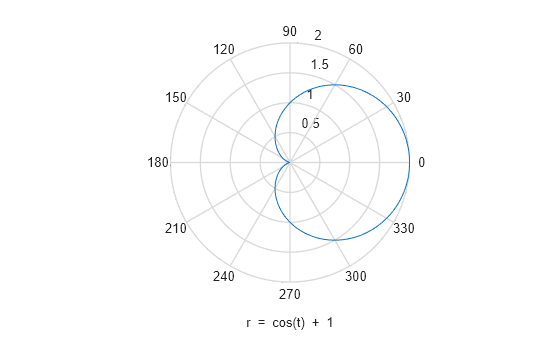
(Not recommended) Polar coordinate plotter
ezpolar is not recommended. Use fpolarplot
instead.
Create a polar plot of the function over the domain .
syms t
ezpolar(1 + cos(t))