3D Convex hull projection on 2D planes
Something like this? %% x=[10 10 40 60 60 60]; y=[0 10 40 30 10 0]; z=[10 13 40 60 57 50]; tri = delaunay(x,y);...
presque 11 ans il y a | 0
| A accepté
Struggling with legend on grouped bar charts (Matlab)
If you use legend show instead of passing in the two names, you'll see what's going on here. In that case you'll get si...
presque 11 ans il y a | 0
| A accepté
Publié le
Object Creation Performance
Object Creation PerformanceBack in January, we looked at the performance of creating a graphics object with a lot of data....
presque 11 ans il y a

How to rotate a quiver object in matlab
The rotate command actually modifies the data of the graphics object, and it doesn't know how to modify all of the different typ...
presque 11 ans il y a | 2
| A accepté
Smooth contours in simple 2D matrix
Contour won't you control the interpolation, but you can do it yourself. You basically need to follow this example I posted on t...
presque 11 ans il y a | 0
How can I use an interpreter (like LaTeX) when setting axis markers?
I assume that by "marker" you mean "ticklabel"? If so, it is separate from the interpreter which is used for titles and labels. ...
presque 11 ans il y a | 11
| A accepté
setting ColorOrderIndex before 1st line is drawn?
If hold is on, then plot resets the ColorOrderIndex. If you just add hold on before your call to plot, then it should d...
presque 11 ans il y a | 1
How can I get a 3D rotation matrix
If you look at the command <http://www.mathworks.com/help/matlab/ref/makehgtform.html makehgtform> , you'll find a form that loo...
presque 11 ans il y a | 1
| A accepté
How do I make round 'o' markers render as round when saving to png
That looks like an issue that the OpenGL driver has on some graphics cards when drawing wide lines. If so, you have a couple of ...
presque 11 ans il y a | 1
| A accepté
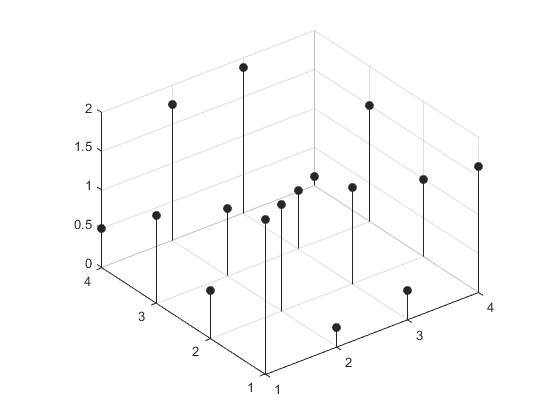
Plot the numbers of a matrix as points (dots) in a plot
Here's a really simple, but inelegant solution: %% A=[1 0 5 7; 3 0 8 4; 6 4 5 2] %% cla axis ij hold on ...
presque 11 ans il y a | 0
| A accepté
Cannot plot additional scatter points in a boxplot
I think it's just that boxplot leaves the YLim in manual mode. Try this: ylim auto
presque 11 ans il y a | 1
| A accepté
Layering SortMethod for 3D Plotting
One option to consider is to place your feature points in a separate axes. The contents of different axes are drawn with childor...
presque 11 ans il y a | 2
| A accepté
Why is MATLAB 2015A placing the text box in the wrong location?
If you mean the text object with the string 'CLASS', then I think that it's the order of the Position and Units properties on yo...
presque 11 ans il y a | 1
| A accepté
2-D Contour plot for non-uniformly spaced data points
The contour commands can handle curvilinear grids, but not multi-resolution grids. So I could do this: [theta,rad] = meshgr...
presque 11 ans il y a | 0
Blurry Text and Lines in Graph
Those are new features that were introduced in R2014b. There are properties for controlling them: <http://www.mathworks.com/e...
presque 11 ans il y a | 0
| A accepté
How could I a draw circle on a 2D surface in 3D?
No, you probably don't want to try and force it into a quad mesh. If you look at your triangle mesh: set(p,'EdgeColor','whi...
presque 11 ans il y a | 0
How can I plot 3D scattared data on a triangulated 3D body
I don't have a good, ready to use example, but I can explain the basic idea. You have a triangle mesh. What you probably want...
environ 11 ans il y a | 0
| A accepté
surf and color bar does not show correct color gradient.
What's happening here is that you have FaceColor='flat'. In this case, it's using your 10x10 matrix as the Z values of the verti...
environ 11 ans il y a | 2
| A accepté
How can I obtain opaque patch in a subplot with a mesh command in another subplot?
You're seeing the edges of the red circles poke through the green circle, aren't you? This isn't actually caused by alpha. He...
environ 11 ans il y a | 0
| A accepté
Publié le
Patch Work
Patch WorkBack before the internet, programmers collected xeroxed copies of old notes and papers. We traded these with our...
environ 11 ans il y a
I want to use ezpolar with line colour, style, width control. Is this possible?
The ezpolar command has a return argument. This is a handle to the graphics object it creates. You can set properties on that: ...
environ 11 ans il y a | 0
| A accepté
Creating a surface plot using Simulink?
There are a few different approaches to this. I described one <http://blogs.mathworks.com/graphics/2014/10/21/double_pendulum/ ...
environ 11 ans il y a | 0
GUI developed in Matalb 2013b behaving weirdly in Matlab 2015a
My guess would be that you have handles to graphics objects in your workspace when you save the MAT file. Consider the following...
environ 11 ans il y a | 2
How to split a contourf plot into two sections with different zooms
The only builtin non-linear scale is log, but you can roll your own. Here's a simple example: %% Start with peaks [x,y,z...
environ 11 ans il y a | 1
| A accepté
Publié le
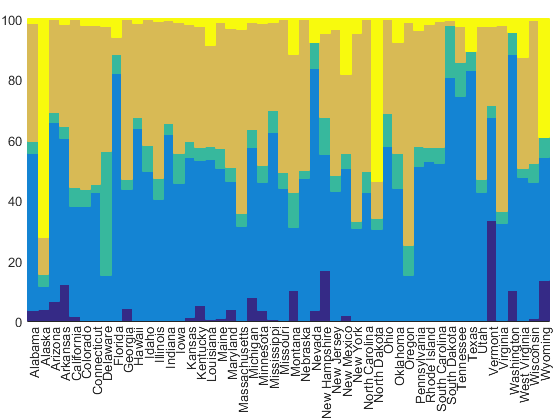
State Taxes
If you live in the US, you probably filed your taxes sometime in the last couple of months. If you're like me, that got you...
environ 11 ans il y a
Linkaxes much slower in 2015a
This is an interesting case. There's a lot of stuff going on here. I'm always looking for good performance cases for <http://blo...
environ 11 ans il y a | 3
| A accepté
Annotation with angled arrow
They are supported, but the default interpreter for annotations is tex. You'll need to set it to latex to get what you want: ...
environ 11 ans il y a | 0
| A accepté
How to insert LaTeX equation into static text/plot in GUI?
These three commands: text(x,y,mystr) annotation('textbox','String',mystr) uicontrol('Style','text','String',mystr) ...
environ 11 ans il y a | 2
| A accepté
How to create simple shapes in Matlab and save them as bitmap images.
Maybe this will be enough to get you started: %% Create Objects figure('Position',[100 100 512 512],'Color','white') ...
environ 11 ans il y a | 0
How to place a marker on a 3D surface plot
Consider the following example: [x,y,z] = peaks; surf(x,y,z) hold on [~,i] = max(z(:)); h = scatter3(x(i),y(i),...
environ 11 ans il y a | 4
| A accepté