Visualization
R2026bThis section introduces the visualization workflows used to interpret the 1903 Wright Flyer flight simulation. You use multiple, complementary visualization approaches to understand both the numerical behavior of the model and the resulting aircraft motion. Together, these views help you assess pitch‑axis dynamics, relate aerodynamic forces to pilot inputs, and evaluate whether the simulated response aligns with the Flyer’s known historical handling characteristics.
1903 Wright Flyer and Pilot with Scopes for Data Visualization
Scopes provide detailed time‑history views of key signals generated by the simulation, including vehicle states, aerodynamic forces and moments, and pilot control inputs. This visualization focuses on how the longitudinal dynamics evolve over time in response to commanded pitch inputs from the pilot model.
Using scopes, you can examine transient and steady‑state behavior, identify coupling between forces and motion, and observe events such as stall or landing conditions detected by assertion blocks in the model. Scopes are particularly useful for validating signal trends, timing, and magnitudes that are not easily interpreted from animation alone.
This model simulates the Flyer’s longitudinal motion under pilot pitch control.
open_system('aeroblk_wf_3dof_noVR');
snapshotModel('aeroblk_wf_3dof_noVR');
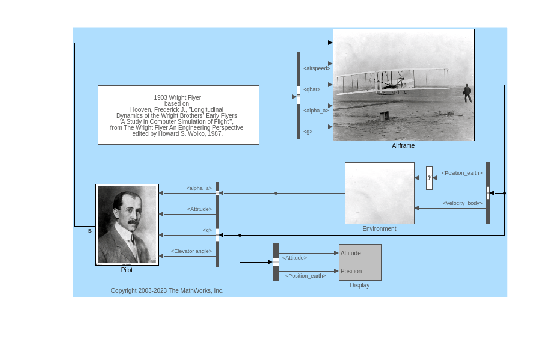
The default values for this simulation allow the Wright Flyer model to take off and land successfully. The pilot reaction time (wf_B3) is set to 0.06 seconds, the desired angle of attack (wf_alphaa) is constant, and the altitude attained is low. The Wright Flyer model reacts similarly to the actual Wright Flyer. It leaves the ground, moves forward, and lands on a point as high as that from which it started. This model exhibits the longitudinal undulation in attitude of the original aircraft.
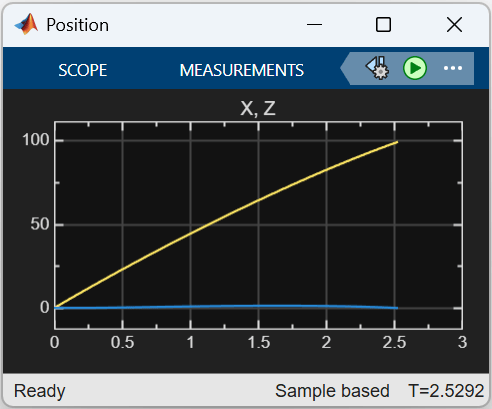
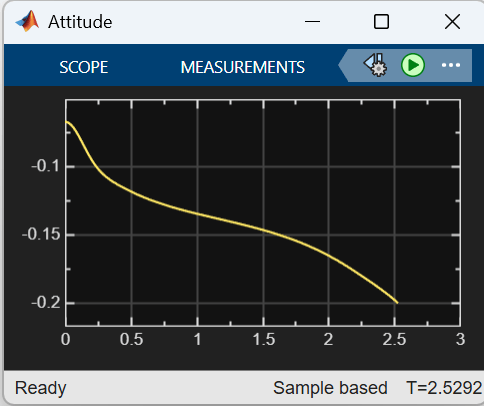
A pilot with quick reaction times and ideal flight conditions makes it possible to fly the Wright Flyer successfully. The Wright Flyer model confirms that controlling its longitudinal motion was a serious challenge. The longest recorded flight on that day lasted a mere 59 seconds and covered 852 feet.
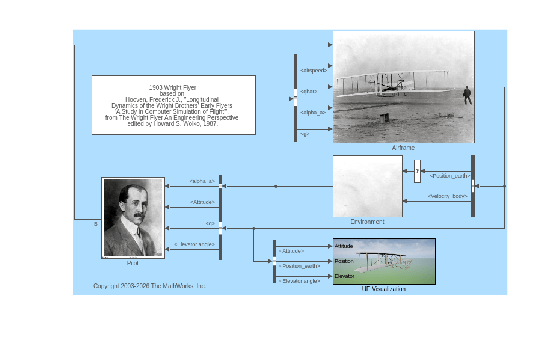
1903 Wright Flyer and Pilot with Simulink 3D Animation
Simulink® 3D Animation™provides a spatial view of the aircraft motion in a virtual environment, complementing the numerical insight from scopes. The 3D visualization shows attitude changes caused by pitch instability and reveals how pitch oscillations influence altitude and trajectory. It shows the aircraft motion during takeoff, climb, and descent, and illustrates how elevator deflections modify the flight path. It shows the motion of the canard elevator and the coupling between pitch attitude and altitude rate. The environment supports real‑time playback synchronized with simulation time and offers multiple camera modes, including chase view, fixed ground view, and cockpit‑aligned view.
You use the 3D environment to verify that the simulated behavior aligns with historical descriptions of the Flyer’s handling qualities. The visualization highlights rapid pitch oscillations, abrupt attitude changes, and the continuous pilot corrections required to maintain controlled flight.
open_system('aeroblk_wf_3dof');
snapshotModel('aeroblk_wf_3dof');
See Also
3DOF (Body Axes) | Incidence & Airspeed | COESA Atmosphere Model | Dynamic Pressure | WGS84 Gravity Model

