coordinateAxes
Description
coordinateAxes( adds a coordinate axes
triad graphic visualization (asset)CoordinateAxes object) for
an asset. In the visualization, the x-axis (roll) is red in color, the
y-axis (pitch) is green, and z-axis (yaw) is
blue.
coordinateAxes(
specifies additional arguments using one or more name-value.asset,Name=Value)
ax = coordinateAxes(___)CoordinateAxes
object.
Examples
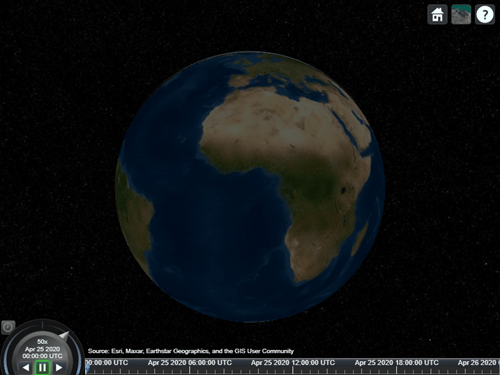
Create a satelliteScenario object.
startTime = datetime(2020,4,25); % April 25, 2020, 12:00 AM UTC
stopTime = datetime(2020,4,26);  % April 26, 2020, 12:00 AM UTC
sampleTime = 60;                 % seconds
sc = satelliteScenario(startTime,stopTime,sampleTime);
Launch a satellite scenario viewer with ShowDetails set to false.
v = satelliteScenarioViewer(sc,ShowDetails=false);
Add a low-earth orbit satellite constellation to the scenario from a TLE file.
tleFile = "leoSatelliteConstellation.tle";
sat = satellite(sc,tleFile);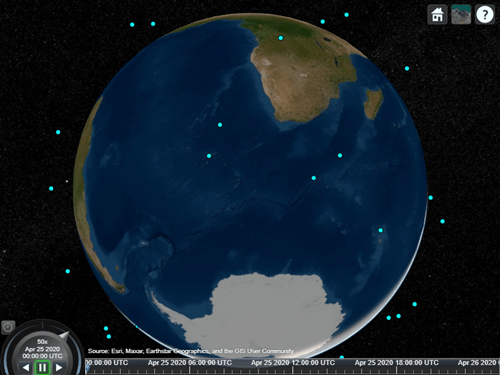
Add a ground station to the scenario.
gs = groundStation(sc);
gs.ShowLabel = true;

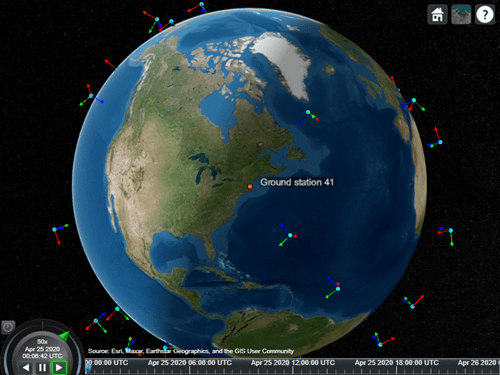
Visualize the coordinate axes triads of the satellites.
ax = coordinateAxes(sat)
ax=1×40 object
    1×1 CoordinateAxes    1×1 CoordinateAxes    1×1 CoordinateAxes    1×1 CoordinateAxes    1×1 CoordinateAxes    1×1 CoordinateAxes    1×1 CoordinateAxes    1×1 CoordinateAxes    1×1 CoordinateAxes    1×1 CoordinateAxes    1×1 CoordinateAxes    1×1 CoordinateAxes    1×1 CoordinateAxes    1×1 CoordinateAxes    1×1 CoordinateAxes    1×1 CoordinateAxes    1×1 CoordinateAxes    1×1 CoordinateAxes    1×1 CoordinateAxes    1×1 CoordinateAxes    1×1 CoordinateAxes    1×1 CoordinateAxes    1×1 CoordinateAxes    1×1 CoordinateAxes    1×1 CoordinateAxes    1×1 CoordinateAxes    1×1 CoordinateAxes    1×1 CoordinateAxes    1×1 CoordinateAxes    1×1 CoordinateAxes
Point the satellites towards the ground station. The coordinate axes triad object updates to represent the new direction of the satellites.
pointAt(sat,gs);

Play the scenario.
play(sc);
Input Arguments
Name-Value Arguments
Output Arguments
Version History
Introduced in R2023a