PatternPlotOptions
Creates option list to customize 3-D radiation pattern for pattern overlay option
Description
patternplot = PatternPlotOptions
creates an option list for a 3-D
radiation pattern for pattern overlay option.
patternplot = PatternPlotOptions(
returns a pattern plot option list based on the specified properties. Properties not
specified retain their default values.Name,Value
)
Examples
Radiation Pattern of Helix Antenna
Plot the radiation pattern of a helix antenna with transparency specified as 0.5.
p = PatternPlotOptions
p = PatternPlotOptions with properties: Transparency: 1 SizeRatio: 0.9000 MagnitudeScale: [] AntennaOffset: [0 0 0]
p.Transparency = 0.5;
ant = helix;
pattern(ant,2e9,'patternOptions',p)
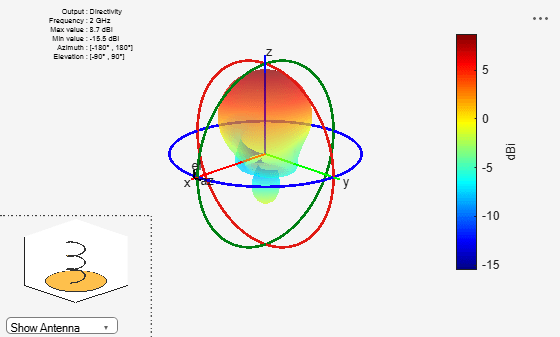
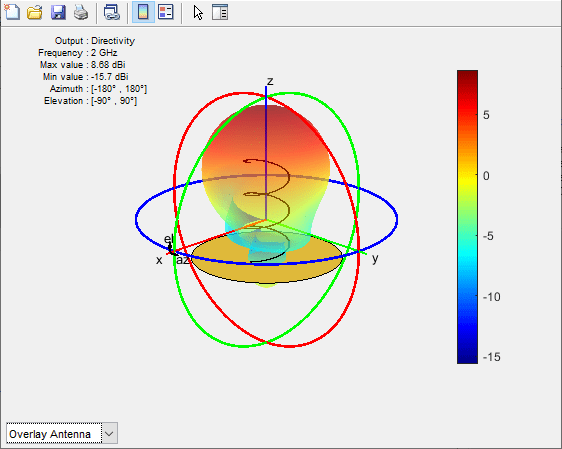
To understand the effect of Transparency, chose Overlay Antenna
in the radiation pattern plot.
This option overlays the helix antenna on the radiation pattern.
Input Arguments
Name-Value Arguments
Example: 'Transparency'
, 0.1
Specify optional comma-separated pairs of Name,Value
pair
arguments. Name
is the argument name and Value
is the
corresponding value. Name
must appear inside single quotes
(''
). You can specify several name and value pair arguments in any
order as Name1, Value1, ..., NameN, ValueN
.
Transparency
— Transparency of 3-D radiation pattern
0.8000
(default) | scalar
Transparency of the 3-D radiation pattern, specified as the comma-separated pair
consisting of 'Transparency'
and a scalar value between
0
and 1
.
Example: 'Transparency'
, 0.5
Example: patternplot.Transparency = 0.5
Data Types: double
SizeRatio
— Relative size of antenna to radiation pattern
0.9000
(default) | positive scalar
Relative size of the antenna to the radiation pattern, specified as the
comma-separated pair of 'SizeRatio'
and a positive scalar.
Example: 'SizeRatio'
, 1
Example: patternplot.SizeRatio = 1
Data Types: double
AntennaOffset
— Position of antenna with pattern center as origin
[0 0 0]
(default) | three-element vector
Position of the antenna with the pattern center as the origin, specified as the
comma-separated pair consisting of 'AntennaOffset'
and a
three-element vector of [x, y, z] coordinates.
Example: 'AntennaOffset'
,
[1,0,0]
Example: patternplot.AntennaOffset = [1,0,0]
Data Types: double
MagnitudeScale
— Scale of radiation pattern
two-element vector
Scale of the radiation pattern, specified as the comma-separated pair consisting
of 'MagnitudeScale'
and a two-element vector of minimum magnitude
and maximum magnitude. If this property is empty, the radiation pattern plot is of the
full range magnitude.
Example: 'MagnitudeScale'
,
[0,1]
Example: patternplot.MagnitudeScale = [0,1]
Data Types: double
Version History
See Also
Ouvrir l'exemple
Vous possédez une version modifiée de cet exemple. Souhaitez-vous ouvrir cet exemple avec vos modifications ?
Commande MATLAB
Vous avez cliqué sur un lien qui correspond à cette commande MATLAB :
Pour exécuter la commande, saisissez-la dans la fenêtre de commande de MATLAB. Les navigateurs web ne supportent pas les commandes MATLAB.
Select a Web Site
Choose a web site to get translated content where available and see local events and offers. Based on your location, we recommend that you select: .
You can also select a web site from the following list:
How to Get Best Site Performance
Select the China site (in Chinese or English) for best site performance. Other MathWorks country sites are not optimized for visits from your location.
Americas
- América Latina (Español)
- Canada (English)
- United States (English)
Europe
- Belgium (English)
- Denmark (English)
- Deutschland (Deutsch)
- España (Español)
- Finland (English)
- France (Français)
- Ireland (English)
- Italia (Italiano)
- Luxembourg (English)
- Netherlands (English)
- Norway (English)
- Österreich (Deutsch)
- Portugal (English)
- Sweden (English)
- Switzerland
- United Kingdom (English)