freqz
Compute frequency response
Description
freqz(___) with no output arguments plots the frequency
response of the filter bank.
Examples
Create a gammatoneFilterBank object. Call freqz to get the complex frequency response, H, of the filter bank and a vector of frequencies, f, at which the response is calculated. Plot the magnitude frequency response of the filter bank.
gammaFiltBank = gammatoneFilterBank;
[H,f] = freqz(gammaFiltBank);

plot(f,abs(H))
xlabel("Frequency (Hz)")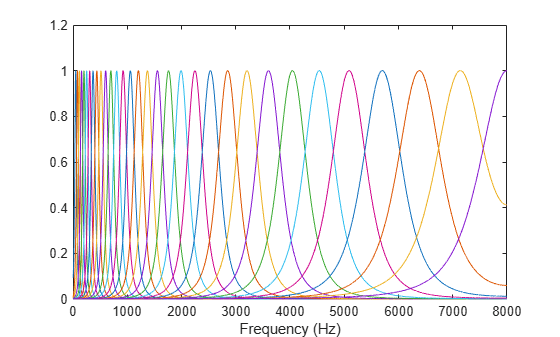
To get the frequency response of a subset of filters in the filter bank, specify the second argument as a row vector of indices between one and the number of filters in the filter bank. Get the frequency response of the 10th filter in the filter bank and plot the magnitude frequency response.
[H,f] = freqz(gammaFiltBank,10);

plot(f,abs(H))
xlabel("Frequency (Hz)")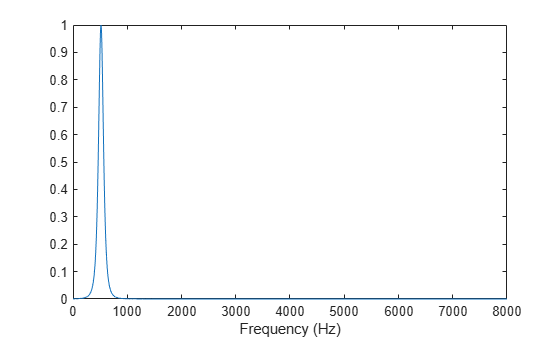
To specify the number of points in the frequency response, use the N name-value argument. Specify that the frequency response contains 128 points. Plot the magnitude frequency response.
[H,f] = freqz(gammaFiltBank,N=128);

plot(f,abs(H))
xlabel("Frequency (Hz)")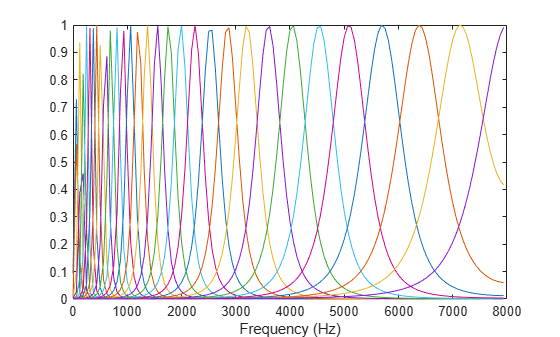
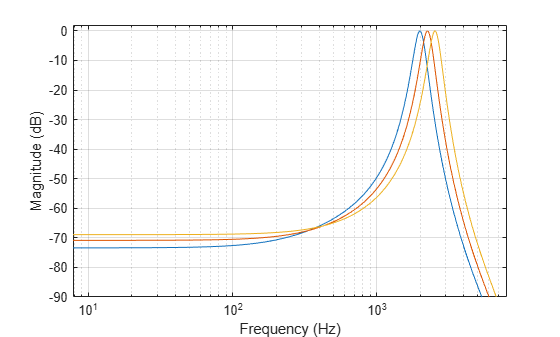
To visualize the magnitude frequency response only, call freqz without any output arguments. Plot the magnitude frequency response, in dB, of filters 20, 21, and 22 with 1024 points.
freqz(gammaFiltBank,[20,21,22],N=1024)
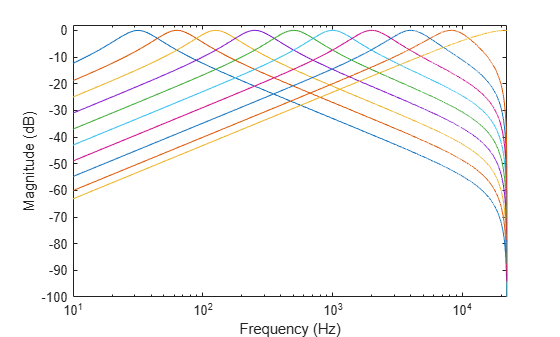
Create an octaveFilterBank object. Call freqz to get the complex frequency response, H, of the filter bank and a vector of frequencies, f, at which the response is calculated. Plot the magnitude frequency response in dB.
octFiltBank = octaveFilterBank;
[H,f] = freqz(octFiltBank);

plot(f,20*log10(abs(H)))
xlabel("Frequency (Hz)")
ylabel("Magnitude (dB)")
set(gca,XScale="log")
axis([10 octFiltBank.SampleRate/2 -100 2])
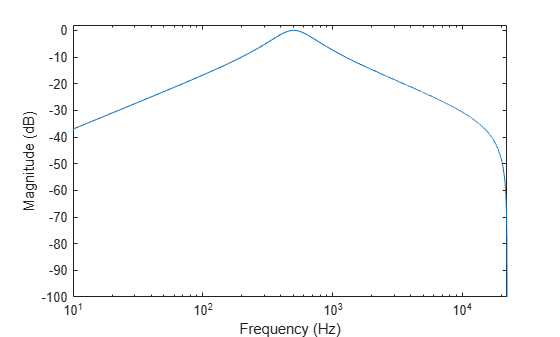
To get the frequency response of a subset of filters in the filter bank, specify the second argument as a row vector of indices between one and the number of filters in the filter bank. Get the frequency response of the 5th filter in the filter bank and plot the magnitude frequency response in dB.
[H,f] = freqz(octFiltBank,5);

plot(f,20*log10(abs(H)))
xlabel("Frequency (Hz)")
ylabel("Magnitude (dB)")
set(gca,XScale="log")
axis([10 octFiltBank.SampleRate/2 -100 2])
To specify the number of points in the frequency response, use the N name-value argument. Specify that the frequency response contains 8192 points. Plot the magnitude frequency response in dB.
[H,f] = freqz(octFiltBank,N=8192);

plot(f,20*log10(abs(H)))
xlabel("Frequency (Hz)")
ylabel("Magnitude (dB)")
set(gca,XScale="log")
axis([10 octFiltBank.SampleRate/2 -100 2])

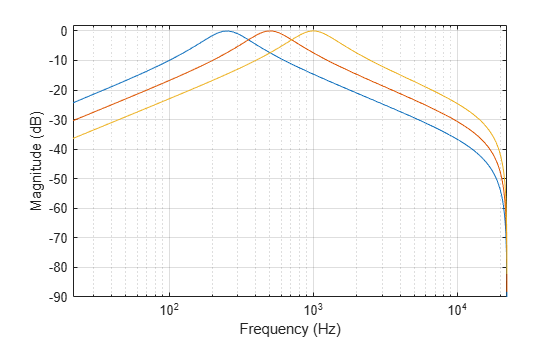
To visualize the magnitude frequency response only, call freqz without any output arguments. Plot the magnitude frequency response, in dB, of filters 4, 5, and 6 with 1024 points.
freqz(octFiltBank,[4,5,6],N=1024)
Input Arguments
Output Arguments
Version History
Introduced in R2019a