Speech Transmission Index - IEC 60268-16 Edition 5.0 Compliance
This example illustrates speechTransmissionIndex compliance with the IEC 60268-16 Edition 5.0 standard [1] by exercising the function with test signals provided in [1] and the accompanying website [2].
Load Test Signals
Call loadTestSignals to return the test signals and expected results. If the test signals are not detected on path, they are generated and saved in the current working directory by the loadTestSignals function. Optionally download test signals from the standard's website [2] and place them on path.
testData = loadTestSignals();
Annex A.2.2 files not found. Generating files ...complete.
Annex A.3.1.2 files not found. Generating files ...complete.
Annex C.3.2 files not found. Generating files ...complete.
Annex C.3.3 files not found. Generating files ...complete.
Annex C.4.2 files not found. Generating files ...complete.
Perform A.2.2 Weighting Factor Tests
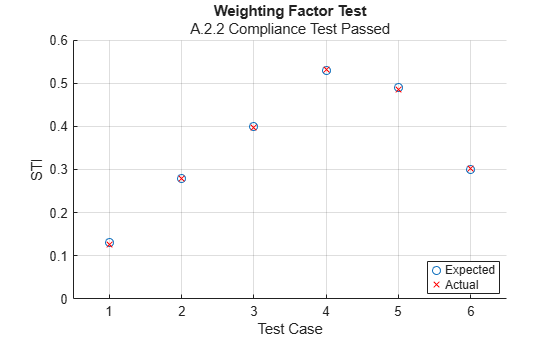
This section verifies that the octave-band weighting and redundancy factors are implemented correctly.
Get the test signals and expected speech transmission index (STI) values.
y = testData.A22.Signals;
fs = testData.A22.SampleRate;
expSTI = testData.A22.Expected.STI;
Compute the actual STI values using the test signals. Disable the addition of operational noise and auditory contributions to test the effects on STI directly. Specify the known modulation depth (0.55) used to generate the speech transmission index for public address systems (STIPA) test signals.
actSTI = NaN(size(expSTI));
for ii = 1:6
    actSTI(ii) = speechTransmissionIndex(y(:,ii),0.55,fs, ...
        AddOperationalAmbientNoise=false, ...
        AddOperationalAuditoryContributions=false);
end
Report compliance and visualize results. The test threshold is set to the resolution of the expected STI given by [2].
testThreshold = 0.01;
isCompliant_A22 = all(abs(expSTI - actSTI) < testThreshold);

figure
hold on
plot(expSTI,"o")
plot(actSTI,"rx")
title("Weighting Factor Test",iPrintResults(isCompliant_A22,"A.2.2"))
xlabel("Test Case")
ylabel("STI")
grid on
axis([0.5,6.5,0,0.6])
legend("Expected","Actual",Location="best")
hold off
Perform A.3.1.2 Filtering and Determination of Intensities
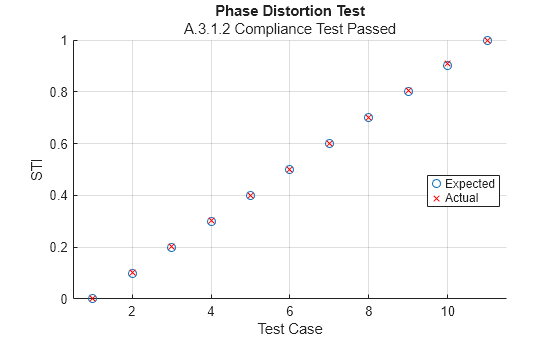
This section verifies that phase distortions introduced by octave-band filters do not cause STI results to vary past a defined threshold.
Get the test signals and expected STI values.
y = testData.A312.Signals;
fs = testData.A312.SampleRate;
expSTI = testData.A312.Expected.STI;
Compute the actual STI values using the test signals. Disable the addition of operational noise and auditory contributions to test the effects on STI directly.
actSTI = NaN(size(expSTI));
for ii = 1:numel(actSTI)
    actSTI(ii) = speechTransmissionIndex(y(:,ii),0.55,fs, ...
        AddOperationalAmbientNoise=false, ...
        AddOperationalAuditoryContributions=false);
end
Report compliance and visualize the results. The standard states that the phase characteristics of the bandpass filters must result in a systematic error less than 0.01 for STI values between 0.1 and 0.9.
testThreshold = 0.01;
isCompliant_A312 = all(abs(expSTI - actSTI) < testThreshold);

figure
hold on
plot(expSTI,"o")
plot(actSTI,"rx")
title("Phase Distortion Test",iPrintResults(isCompliant_A312,"A.3.1.2"))
xlabel("Test Case")
ylabel("STI")
grid on
axis([0.5,11.5,0,1])
legend("Expected","Actual",Location="best")
hold off
Perform C.3.2 Modulation Depth Testing for STIPA Direct Method
This section verifies that modulation depth is correctly calculated for the STIPA direct method.
Get the test signals and expected STI and m-values.
y = testData.C32.Signals;
fs = testData.C32.SampleRate;
expSTI = testData.C32.Expected.STI;
expM = testData.C32.Expected.M;
Compute the actual m-values using the test signals. Disable the addition of operational noise and auditory contributions to isolate the effects.
actSTI = NaN(size(expSTI));
actM = cell(size(y,2),1);
for ii = 1:size(y,2)
    [actSTI(ii),~,mk] = speechTransmissionIndex(y(:,ii),0.55,fs, ...
        AddOperationalAmbientNoise=false, ...
        AddOperationalAuditoryContributions=false);
    actM{ii} = table2array(mk);
end
actM = cat(1,actM{:});
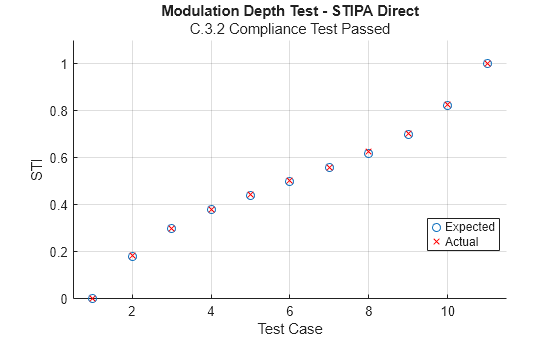
Report compliance and visualize the results. The standard states that the error between the theoretical and actual m-values must not exceed 0.05. The standard also states that the m-value errors can not result in a systematic absolute error in the STI results greater than 0.01.
testThreshold_m = 0.05;
testThreshold_sti = 0.01;
isCompliant_C32 = all(abs(repelem(expM(:),2) - actM) < testThreshold_m,"all") && ...
    (sum(abs(round(actSTI,2) - expSTI),"all") < testThreshold_sti);

figure
hold on
plot(repelem(expM(:),2),"o")
plot(actM,"rx")
title("Modulation Depth Test - STIPA Direct",iPrintResults(isCompliant_C32,"C.3.2"))
xlabel("Test Case")
ylabel("m-value")
grid on
axis([0.5,11.5,0,0.6])
legend("Expected","Actual",Location="best");
hold off
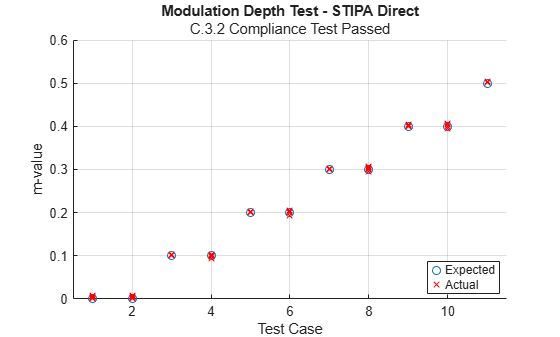
figure
hold on
plot(expSTI,"o")
plot(actSTI,"rx")
title("Modulation Depth Test - STIPA Direct",iPrintResults(isCompliant_C32,"C.3.2"))
xlabel("Test Case")
ylabel("STI")
grid on
axis([0.5,11.5,0,1.1])
legend("Expected","Actual",Location="best")
hold off
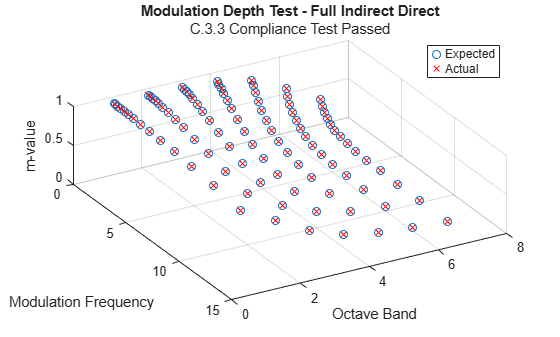
Perform C.3.3 Modulation Depth Testing for STI Indirect Method
This section verifies that modulation depth is correctly calculated for the indirect method.
Get the test signals and expected m-values.
y = testData.C33.Signals;
fs = testData.C33.SampleRate;
expM = testData.C33.Expected.M;
Compute the actual m-values using the test signals.
actM = NaN(14,7,7);
for ii = 1:size(y,2)
    [~,~,mk] = speechTransmissionIndex(y(:,ii),fs);
    actM(:,:,ii) = table2array(mk);
end
Report compliance and visualize the results. The standard states that the error between the theoretical and actual m-values must not exceed 0.05 and systemic absolute errors must be less than 0.01.
testThreshold_m = 0.05;
testThreshold_mSys = 0.01;
m_error = abs(expM - actM);
isCompliant_C33 = ~any(m_error(:) >= testThreshold_m) && (mean(m_error(:)) < testThreshold_mSys);
For visualization, analyze only one RT-60 value at a time.
rt60toAnalyze =4; expSlice = squeeze(expM); actSlice = squeeze(actM(:,rt60toAnalyze,:)); [fm, oct] = ndgrid(10.^((-2:11)/10), 1:size(expSlice,2)); figure hold on plot3(fm(:),oct(:),expSlice(:),"o") plot3(fm(:),oct(:),actSlice(:),"rx") title("Modulation Depth Test - Full Indirect Direct",iPrintResults(isCompliant_C33,"C.3.3")) xlabel("Modulation Frequency") ylabel("Octave Band") zlabel("m-value") grid on legend("Expected","Actual",Location="best") view([60 60]) hold off
Perform C.4.2 Octave Band Filter Testing - STIPA Direct Method
This section verifies that crosstalk in the octave filter bank does not increase the effective noise level by more than 3 dB.
Get the test signals.
y = testData.C42.Signals;
fs = testData.C42.SampleRate;

y_low = y(:,1:2:end);
y_high = y(:,2:2:end);
For each octave band filter, test the lower and upper slopes.
C42results = array2table(NaN(4,7), ...
    VariableNames = string([125,250,500,1000,2000,4000,8000]), ...
    RowNames=["f1 low","f1 high","f2 low", "f2 high"]);

depth = 0.5;
for ii = 1:size(C42results,2)
    % Get m-values
    [~,~,mk_low] = speechTransmissionIndex(y_low(:,ii),depth,fs);
    [~,~,mk_high] = speechTransmissionIndex(y_high(:,ii),depth,fs);

    % Save the modulation depths for the observed octave band for both modulation
    % frequencies. Multiply the mtf values by the mi (known input depth)
    % values to get the mo-values.
    C42results{:,ii} = [mk_low{1,ii};mk_high{1,ii};mk_low{2,ii};mk_high{2,ii}].*depth;
end
Report compliance and display results. For compliance, the m-values in the observed octave band must be 0.45 or higher.
threshold = 0.45;
isCompliant_C42 = all(table2array(C42results) > threshold,"all");
C42resultsC42results=4×7 table
125 250 500 1000 2000 4000 8000
_______ _______ _______ _______ _______ _______ _______
f1 low 0.5429 0.5423 0.54178 0.54332 0.54196 0.53949 0.52806
f1 high 0.54352 0.54252 0.54191 0.54419 0.54461 0.54721 0.55079
f2 low 0.54825 0.5434 0.5396 0.5477 0.54326 0.54121 0.53768
f2 high 0.54908 0.54313 0.53983 0.54823 0.54595 0.5486 0.55931
disp(iPrintResults(isCompliant_C42,"C.4.2"))C.4.2 Compliance Test Passed
Conclusion
Verify speechTransmissionIndex complies with all provided test signals of IEC 60268-16, Edition 5.0.
isCompliant = isCompliant_C42 && isCompliant_C33 && isCompliant_C32 && isCompliant_A22 && isCompliant_A312;
if isCompliant
    disp("speechTransmissionIndex complies with IEC 60268-16, Edition 5.0.")
else
    disp("speechTransmissionIndex does not comply with IEC 60268-16, Edition 5.0.")
end
speechTransmissionIndex complies with IEC 60268-16, Edition 5.0.
Supporting Functions
Load Test Signals
function testData = loadTestSignals()

% Define common parameters
octavebandcenters = [125,250,500,1000,2000,4000,8000];
tableB1 = table([1.6;8.0],[1;5],[0.63;3.15],[2.0;10.0],[1.25;6.25],[0.8;4],[2.5;12.5], ...
    VariableNames = string(octavebandcenters), ...
    RowNames=["f1","f2"]);
fs = 48e3;

testData = struct();

% Annex A.2.2
files = {"STIPA-sine-pair[125+250]STI=0.13.wav", ...
    "STIPA-sine-pair[250+500]STI=0.28.wav", ...
    "STIPA-sine-pair[500+1000]STI=0.4.wav", ...
    "STIPA-sine-pair[1000+2000]STI=0.53.wav", ...
    "STIPA-sine-pair[2000+4000]STI=0.49.wav", ...
    "STIPA-sine-pair[4000+8000]STI=0.3.wav"};
onPath = cellfun(@(f)exist(f,"file")==2,files);
if ~onPath
    fprintf(1,"Annex A.2.2 files not found. Generating files ...")
    iGenerateSignals_A22(tableB1,fs);
    fprintf("complete.\n")
end
y = cell(numel(files),1);
for ii = 1:numel(files)
    y{ii} = audioread(files{ii});
end
testData.A22.Signals = cat(2,y{:});
testData.A22.SampleRate = fs;
testData.A22.Expected.STI = [0.13,0.28,0.4,0.53,0.49,0.3];

% Annex A.3.1.2
files = {"STIPA-sine-edge-carriers-TI=0[m=0].wav", ...
    "STIPA-sine-edge-carriers-TI=0.1[m=0.059351].wav", ...
    "STIPA-sine-edge-carriers-TI=0.2[m=0.11182].wav", ...
    "STIPA-sine-edge-carriers-TI=0.3[m=0.20076].wav", ...
    "STIPA-sine-edge-carriers-TI=0.4[m=0.33386].wav", ...
    "STIPA-sine-edge-carriers-TI=0.5[m=0.5].wav", ...
    "STIPA-sine-edge-carriers-TI=0.6[m=0.66614].wav", ...
    "STIPA-sine-edge-carriers-TI=0.7[m=0.79924].wav", ...
    "STIPA-sine-edge-carriers-TI=0.8[m=0.88818].wav", ...
    "STIPA-sine-edge-carriers-TI=0.9[m=0.94065].wav", ...
    "STIPA-sine-edge-carriers-TI=1[m=1].wav" ...
    };
onPath = cellfun(@(f)exist(f,"file")==2,files);
if ~onPath
    fprintf(1,"Annex A.3.1.2 files not found. Generating files ...")
    iGenerateSignals_A312(tableB1,fs);
    fprintf("complete.\n")
end
y = cell(numel(files),1);
for ii = 1:numel(files)
    y{ii} = audioread(files{ii});
end
testData.A312.Signals = cat(2,y{:});
testData.A312.SampleRate = fs;
testData.A312.Expected.STI = 0:0.1:1;

% Annex C.3.2
files = {"STIPA-sinecarrier-M=0.wav", ...
    "STIPA-sinecarrier-M=0.1.wav", ...
    "STIPA-sinecarrier-M=0.2.wav", ...
    "STIPA-sinecarrier-M=0.3.wav", ...
    "STIPA-sinecarrier-M=0.4.wav", ...
    "STIPA-sinecarrier-M=0.5.wav", ...
    "STIPA-sinecarrier-M=0.6.wav", ...
    "STIPA-sinecarrier-M=0.7.wav", ...
    "STIPA-sinecarrier-M=0.8.wav", ...
    "STIPA-sinecarrier-M=0.9.wav", ...
    "STIPA-sinecarrier-M=1.wav" ...
    };
onPath = cellfun(@(f)exist(f,"file")==2,files);
if ~onPath
    fprintf(1,"Annex C.3.2 files not found. Generating files ...")
    iGenerateSignals_C32(tableB1,fs);
    fprintf("complete.\n")
end
y = cell(numel(files),1);
for ii = 1:numel(files)
    y{ii} = audioread(files{ii});
end
testData.C32.Signals = cat(2,y{:});
testData.C32.SampleRate = fs;
testData.C32.Expected.M = 0:0.1:1;
testData.C32.Expected.STI = [0; 0.18; 0.30; 0.38; 0.44; 0.5; 0.56; 0.62; 0.70; 0.82; 1];

% Annex C.3.3
files = {"STIPA-expdecay-RT60=0.125.wav", ...
    "STIPA-expdecay-RT60=0.25.wav", ...
    "STIPA-expdecay-RT60=0.5.wav", ...
    "STIPA-expdecay-RT60=1.wav", ...
    "STIPA-expdecay-RT60=2.wav", ...
    "STIPA-expdecay-RT60=4.wav", ...
    "STIPA-expdecay-RT60=8.wav", ...
    };
onPath = cellfun(@(f)exist(f,"file")==2,files);
if ~onPath
    fprintf(1,"Annex C.3.3 files not found. Generating files ...")
    iGenerateSignals_C33(fs,true);
    fprintf("complete.\n")
end
y = cell(numel(files),1);
for ii = 1:numel(files)
    y{ii} = audioread(files{ii});
end
testData.C33.Signals = cat(2,y{:});
testData.C33.SampleRate = fs;
[~,expM] = iGenerateSignals_C33(fs,false);
testData.C33.Expected.M = expM;

% Annex C.4.2
files = {"Filtertest_lowslope 125.wav", ...
    "Filtertest_highslope 125.wav", ...
    "Filtertest_lowslope 250.wav", ...
    "Filtertest_highslope 250.wav", ...
    "Filtertest_lowslope 500.wav", ...
    "Filtertest_highslope 500.wav", ...
    "Filtertest_lowslope 1000.wav", ...
    "Filtertest_highslope 1000.wav", ...
    "Filtertest_lowslope 2000.wav", ...
    "Filtertest_highslope 2000.wav", ...
    "Filtertest_lowslope 4000.wav", ...
    "Filtertest_highslope 4000.wav", ...
    "Filtertest_lowslope 8000.wav", ...
    "Filtertest_highslope 8000.wav"
    };
onPath = cellfun(@(f)exist(f,"file")==2,files);
if ~onPath
    fprintf(1,"Annex C.4.2 files not found. Generating files ...")
    iGenerateSignals_C42(tableB1,fs);
    fprintf("complete.\n")
end
y = cell(numel(files),1);
for ii = 1:numel(files)
    y{ii} = audioread(files{ii});
end
testData.C42.Signals = cat(2,y{:});
testData.C42.SampleRate = fs;
end
Generate Signals for A.2.2 Weighting Factor Tests
IEC 60268-16 Edition 5.0 provides the following table of MTI octave band weighting factors (Table A.1) for use in the speech transmission index (STI) algorithm. The variables represent the MTI octave bands and the rows represent the weighting factors (alpha) and redundancy factors (beta).
tableA1 = table([0.085;0.085],[0.127;0.078],[0.230;0.065],[0.233;0.011],[0.309;0.047],[0.224;0.095],[0.173;NaN], ...
    VariableNames = ["125","250","500","1000","2000","4000","8000"], ...
    RowNames=["alpha","beta"])
tableA1=2×7 table
              125      250      500     1000     2000     4000     8000
             _____    _____    _____    _____    _____    _____    _____

    alpha    0.085    0.127     0.23    0.233    0.309    0.224    0.173
    beta     0.085    0.078    0.065    0.011    0.047    0.095      NaN
STI is derived from the adjusted modulation transfer index and the weighting factors as defined in section A.2.1
where
is the modulation transfer index for octave bank .
is the weighting factor for octave band .
is the redundancy factor between octave band and octave band +1.
To verify that the weighting factors are set correctly, we can test the system with signals that we know result in a modulation transfer index of 1. The modulation transfer index is defined as the mean of the transmission indices over the modulation frequencies:
where
is the transmission index for each octave band and modulation frequency .
is the index of the modulation frequency.
is the number of modulation frequencies per octave band.
Generate test signals as described by IEC 60268-16 companion website [2]. For each test signal, verify that the theoretical STI is within threshold.
function [y,expSTI] = iGenerateSignals_A22(tableB1,fs)
dur = 30;
tVec = ((0:((dur*fs)-1))/fs)';

% Get octave band center the modulation frequencies
oct = str2double(tableB1.Properties.VariableNames);
f1 = tableB1{"f1",:};
f2 = tableB1{"f2",:};

alpha = [0.085 0.127 0.230 0.233 0.309 0.224 0.173];
beta = [0.085 0.078 0.065 0.011 0.047 0.095];

fs = 48e3;

G = 1;
for p = 1:6
    expSTI = round(alpha(p) + alpha(p+1) - beta(p),2);
    y = zeros(numel(tVec),1);
    for j = 1:length(oct)

        carrier = sin(2*pi*oct(j).*tVec);

        if j==p||j==(p+1)  % only modulate two adjacent bands
            modulator = sqrt(0.5*(1 + 0.55*(sin(2*pi*f1(j)*tVec) - sin(2*pi*f2(j)*tVec))));
        else
            modulator = sqrt(0.5);
        end

        y = y + G*modulator.*carrier;
    end
    y = y./max(abs(y));
    audiowrite("STIPA-sine-pair["+oct(p)+"+"+oct(p+1)+"]STI="+expSTI+".wav",y,fs)

end
end
Generate Signals for A.3.1.2 Filtering and Determination of Intensities
Generate a test signal following [2]. The test signals consist of the STIPA modulators and sine carriers 1/4 octave on either side of the octave band center frequencies.
function [y,expSTI] = iGenerateSignals_A312(tableB1,fs)
dur = 30;
tVec = ((0:((dur*fs)-1))/fs)';

% Get octave band center the modulation frequencies
oct = str2double(tableB1.Properties.VariableNames);
f1 = tableB1{"f1",:};
f2 = tableB1{"f2",:};

% Define target (ideal) TI values.
refTI = 0:0.1:1;

% Assume STI approx TI. Levels per band set to 0 dB necessary for assumption.
expSTI = refTI;

% Derive the m-values that would result in the target STI without auditory masking.
SNR = refTI*30 - 15;
E = 10.^(SNR/10);
m = E./(1+E);
m(1) = 0;
m(end) = 1;

% Define two carriers 1/2 octave apart centered around each octave band and
% then sum them
c = 2^(1/4);
carrier1 = sin(2*pi*(oct/c).*tVec);
carrier2 = sin(2*pi*(oct*c).*tVec);
carriers = carrier1 + carrier2;

% Define STIPA modulators
modulator = sqrt(0.5*(1 + 0.55*permute(m,[3,1,2]).*(sin(2*pi.*f1.*tVec) - sin(2*pi.*f2.*tVec))));

% Combine modulators and carriers
y = permute(sum(modulator.*carriers,2),[1,3,2]);

y = y./max(abs(y));

for ii = 1:numel(expSTI)
    audiowrite("STIPA-sine-edge-carriers-TI="+refTI(ii)+"[m="+m(ii)+"].wav",y(:,ii),fs)
end
end
Generate Signals for C.3.2 Modulation Depth Testing for STIPA Direct Method
Generate test signals according to 60268-16, Edition 5.0: C.3.2 for use in testing the STIPA direct method modulation depth calculation.
The standard prescribes the use of a STIPA-like test signal but with the noise carriers replaced with sine wave carriers. Equation C.1 in the standard defines the test signal.
(C.1)
where
is the octave band index .
is the octave band center frequency in Hz
is the time variable in seconds.
is the specified m value, for the range 0 to 1 in 0.1 steps.
is the lower modulation frequency in Hz.
is the higher modulation frequency in Hz.
function [y,mvalues,expSTI] = iGenerateSignals_C32(tableB1,fs)
dur = 30;
tVec = ((0:((dur*fs)-1))/fs)';

% Get octave band center the modulation frequencies
oct = str2double(tableB1.Properties.VariableNames);
f1 = tableB1{"f1",:};
f2 = tableB1{"f2",:};

mvalues = 0:0.1:1;

% These values are obtained by converting the m-values to STI directly
expSTI = [0; 0.18; 0.30; 0.38; 0.44; 0.5; 0.56; 0.62; 0.70; 0.82; 1];

% IEC 602618-16:2020 A.6.1 Standardized speech spectrum
Levels = db2mag([-2.5,0.5,0,-6,-12,-18,-24]);

for ii = 1:numel(mvalues)
    m = mvalues(ii);

    carriers = sin(2*pi*oct.*tVec);
    modulators = sqrt(0.5*(1 + 0.55*m*(sin(2*pi.*f1.*tVec) - sin(2*pi*f2.*tVec))));
    y = sum(Levels.*carriers.*modulators,2);
    y = y./max(abs(y));
    audiowrite("STIPA-sinecarrier-M="+m+".wav",y,fs)
end

end
Generate Signals for C.3.3 Modulation Depth Testing for STI Indirect Method
The indirect method calculates the m-values from the impulse response. Equation C.2 in the standard defines an exponentially decaying sine wave as a function of RT-60 for use as a stand in.
(C.2)
where
is the octave band index .
is the octave band center frequency in Hz.
is the time variable in seconds.
is the reverberation time in seconds.
The RT-60 values to report on are: 0.125 s, 0.25 s, 0.5 s, 1 s, 2 s, 4 s, and 8 s.
For a given reverberation time, the m-values derived from the impulse response defined in equation C.2 should match the theoretical m-values given in equation C.3 in the standard.
(C.3)
where
is the m value.
is the modulation frequency in Hz.
is the reverberation time in seconds.
is the natural logarithm, .
function [A,m_theoretical] = iGenerateSignals_C33(fs,dowrite)

dur = 18;
tVec = ((0:((dur*fs)-1))/fs)';

% Define the RT60 values to test.
RT60 = permute(2.^(-3:3),[1,3,2]);

% Define the octave band center frequencies.
fc = [125,250,500,1000,2000,4000,8000];

% Compute equation C.2, the exponential decaying sine curve for each octave band and for each RT-60 value.
% Average the octave bands for each RT-60 value.
A = permute(mean(sin(2*pi*fc.*tVec).*1000.^-(tVec./RT60),2),[1,3,2]); % C.2

% Define the 14 modulation frequencies to test. STI modulation frequencies are given in Annex A.1.4.
f_m = 10.^((-2:11)/10);

% Compute equation C.3, the theoretical m-values.
m_theoretical = permute(1./ (sqrt(1 + ((2*pi.*f_m.*RT60)./log(10^6)).^2)),[2,1,3]);

if dowrite
for ii = 1:numel(RT60)
    audiowrite("STIPA-expdecay-RT60="+RT60(ii)+".wav",A(:,ii),fs)
end
end
end
Generate Signals for C.4.2 Octave Band Filter Testing - STIPA Direct Method
The standard prescribes that octave filter bank slopes are checked using a 100 % modulated sine carrier in the observed band at a relative -41 dB level with a non-modulated carrier in an adjacent octave band. If the slope of the bandpass filter is 41 dB/octave then the resulting m-value should be 0.5, corresponding to an SNR of 0 dB. The test signals are defined by equations C.4 and C.5 in the standard:
(C.4)
(C.5)
where
is the octave band index .
is the octave band center frequency in Hz.
is the time variable in seconds.
is the lower modulation frequency in Hz.
is the higher modulation frequency in Hz.
is the lower octave non modulated carrier frequency in Hz.
is the higher octave non modulated carrier frequency in Hz.
function [y_low,y_high] = iGenerateSignals_C42(tableB1,fs)
dur = 30;
tVec = ((0:((dur*fs)-1))/fs)';
for ii = 1:size(tableB1,2)

    % Get octave band center the modulation frequencies
    oct = str2double(tableB1.Properties.VariableNames{ii});
    f1 = tableB1{"f1",ii};
    f2 = tableB1{"f2",ii};

    % Create the test signals
    modulator = sqrt(0.5*(1 + 0.55*(sin(2*pi*f1.*tVec) - sin(2*pi*f2.*tVec))));
    carrier = sin(2*pi*oct.*tVec);
    y = (10^(-41/20))*carrier.*modulator;
    y_low = y + 10^(-3/20)*sin(2*pi*(oct/2)*tVec); % (C.4)
    y_high = y + 10^(-3/20)*sin(2*pi*(2*oct)*tVec); % (C.5)

    audiowrite("Filtertest_highslope "+oct+".wav",y_high,fs)
    audiowrite("Filtertest_lowslope "+oct+".wav",y_low,fs)
end
end
Print Results
function results = iPrintResults(iscompliant,section)
if iscompliant
    results = section + " Compliance Test Passed";
else
    results = section + " Compliance Test Failed";
end
end
References
[1] IEC 60268-16:2020. "Sound system equipment - Part 16: Objective rating of speech intelligibility by speech transmission index." International Electrotechnical Commission.
[2] “Home.” Accessed April 29, 2025. http://www.stipa.info/.
See Also
speechTransmissionIndex | stipaExcitation | acousticRoomResponse | fftfilt | rt60