sortClasses
Sort classes of confusion matrix chart
Syntax
Description
Examples
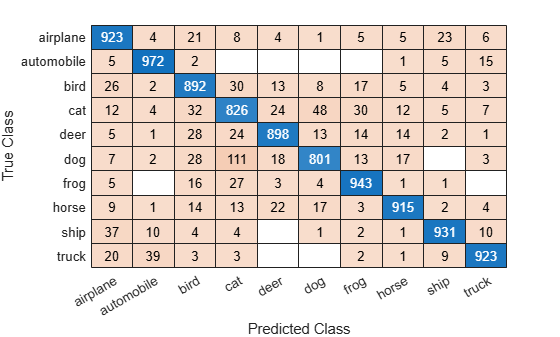
Load a sample of predicted and true labels for a classification problem. trueLabels are the true labels for an image classification problem and predictedLabels are the predictions of a convolutional neural network. Create a confusion matrix chart.
load('Cifar10Labels.mat','trueLabels','predictedLabels');
figure
cm = confusionchart(trueLabels,predictedLabels);
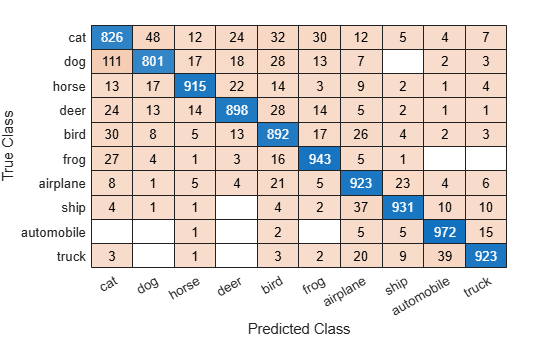
Reorder the classes of the confusion matrix chart so that the classes are in a fixed order.
sortClasses(cm, ...
    ["cat" "dog" "horse" "deer" "bird" "frog", ...
    "airplane" "ship" "automobile" "truck"])
Load a sample of predicted and true labels for a classification problem. trueLabels are the true labels for an image classification problem and predictedLabels are the predictions of a convolutional neural network. Create a confusion matrix chart with column and row summaries.
load('Cifar10Labels.mat','trueLabels','predictedLabels');
figure
cm = confusionchart(trueLabels,predictedLabels, ...
    'ColumnSummary','column-normalized', ...
    'RowSummary','row-normalized');
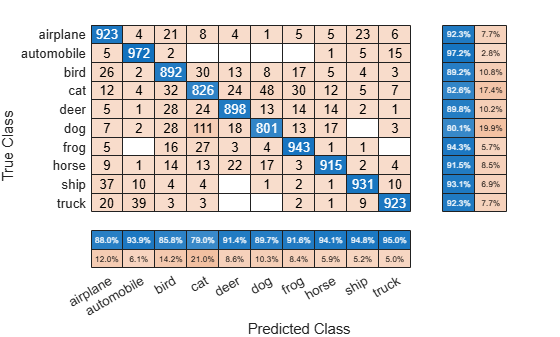
To sort the classes of the confusion matrix by class-wise recall (true positive rate), normalize the cell values across each row, that is, by the number of observations that have the same true class. Sort the classes by the corresponding diagonal cell values and reset the normalization of the cell values. The classes are now sorted such that the percentages in the blue cells in the row summaries to the right are decreasing.
cm.Normalization = 'row-normalized';
sortClasses(cm,'descending-diagonal');
cm.Normalization = 'absolute';
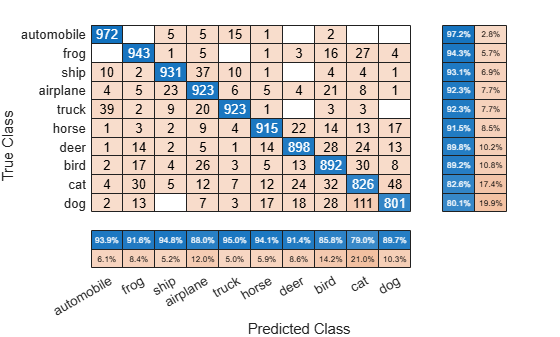
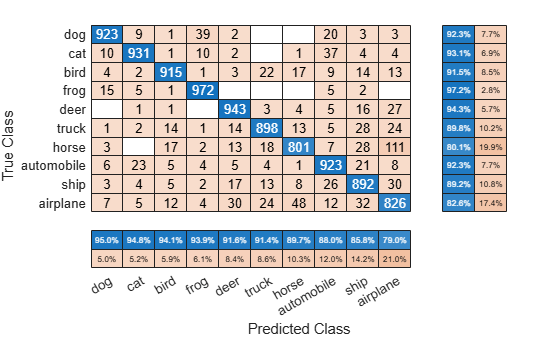
To sort the classes by class-wise precision (positive predictive value), normalize the cell values across each column, that is, by the number of observations that have the same predicted class. Sort the classes by the corresponding diagonal cell values and reset the normalization of the cell values. The classes are now sorted such that the percentages in the blue cells in the column summaries at the bottom are decreasing.
cm.Normalization = 'column-normalized';
sortClasses(cm,'descending-diagonal');
cm.Normalization = 'absolute';
Input Arguments
Version History
Introduced in R2018b