birdsEyePlot
Plot detections, tracks, and sensor coverages around vehicle
Description
The birdsEyePlot object displays a bird's-eye
plot of a 2-D driving scenario in the immediate vicinity of an ego vehicle. You can use
this plot with sensors capable of detecting objects and lanes.
To display aspects of a driving scenario on a bird’s-eye plot:
Create a
birdsEyePlotobject.Create plotters for the aspects of the driving scenario that you want to plot.
Use the plotters with their corresponding plot functions to display those aspects on the bird's-eye plot.
This table shows the plotter functions to use based on the driving scenario aspect that you want to plot.
| Driving Scenario Aspect to Plot | Plotter Creation Function | Plotter Display Function |
|---|---|---|
| Sensor coverage areas | coverageAreaPlotter | plotCoverageArea |
| Sensor detections | detectionPlotter,
rangeDetectionPlotter | plotDetection,
plotRangeDetection |
| Lane boundaries | laneBoundaryPlotter | plotLaneBoundary |
| Lane markings | laneMarkingPlotter | plotLaneMarking, plotParkingLaneMarking |
| Object meshes | meshPlotter | plotMesh |
| Object outlines | outlinePlotter | plotOutline, plotBarrierOutline |
| Ego vehicle path | pathPlotter | plotPath |
| Point cloud | pointCloudPlotter | plotPointCloud |
| Object tracking results | trackPlotter | plotTrack |
For an example of how to configure and use a bird's-eye plot, see Visualize Sensor Coverage, Detections, and Tracks.
Creation
Description
bep = birdsEyePlot
bep = birdsEyePlot(Name,Value)Name,Value pair
arguments. For example, birdsEyePlot('XLimits',[0 60],'YLimits',[-20
20]) displays the area that is 60 meters in front of the ego
vehicle and 20 meters to either side of the ego vehicle. Enclose each property
name in quotes.
Properties
Axes on which to plot, specified as an axes handle. By default, the
birdsEyePlot object uses the current axes handle, which
is returned by the gca function.
Plotters created for the bird's-eye plot, specified as an array of plotter objects.
X-axis range of the bird's-eye plot, in vehicle
coordinates, specified as a real-valued vector of the form
[Xmin
Xmax]. Units are in meters. If you
do not specify XLimits, then the plot uses the default
values for the parent axes.
The X-axis is vertical and positive in the forward direction of the ego vehicle. The origin is at the center of the rear axle of the ego vehicle.

For more details on the coordinate system used in the bird's-eye plot, see Vehicle Coordinate System.
Y-axis range of the bird's-eye plot, in vehicle
coordinates, specified as a real-valued vector of the form
[Ymin
Ymax]. Units are in meters. If you
do not specify YLimits, then the plot uses the default
values for the parent axes.
The Y-axis runs horizontally and is positive to the left of the ego vehicle, as viewed when facing forward. The origin is at the center of the rear axle of the ego vehicle.

For more details on the coordinate system used in the
birdsEyePlot object, see Vehicle Coordinate System.
Object Functions
Examples
Create a bird's-eye plot with an x-axis range from 0 to 90 meters and a y-axis range from –35 to 35 meters.
bep = birdsEyePlot('XLim',[0 90],'YLim',[-35 35]);

Display a coverage area with a 35-degree field of view and a 60-meter range.
caPlotter = coverageAreaPlotter(bep,'DisplayName','Radar coverage area');
mountPosition = [1 0];
range = 60;
orientation = 0;
fieldOfView = 35;
plotCoverageArea(caPlotter,mountPosition,range,orientation,fieldOfView);

Display radar detections with coordinates at (30, –5), (50, –10), and (40, 7).
radarPlotter = detectionPlotter(bep,'DisplayName','Radar detections');
plotDetection(radarPlotter,[30 -5; 50 -10; 40 7]);

Create a bird's-eye plot with an x-axis range of 0 to 90 meters and a y-axis range from –35 to 35 meters. Configure the plot to include a radar coverage area plotter and a detection plotter. Set the display names of these plotters.
bep = birdsEyePlot('XLim',[0 90],'YLim',[-35 35]);
coverageAreaPlotter(bep,'DisplayName','Radar coverage area');
detectionPlotter(bep,'DisplayName','Radar detections');

Use findPlotter to locate the plotters by their display names.
caPlotter = findPlotter(bep,'DisplayName','Radar coverage area');
radarPlotter = findPlotter(bep,'DisplayName','Radar detections');
Plot the coverage area and detected objects.
plotCoverageArea(caPlotter,[1 0],30,0,35);
plotDetection(radarPlotter,[30 5; 30 -10; 30 15]);

Clear data from the plot.
clearPlotterData(bep);

Limitations
The rectangle-zoom feature, where you draw a rectangle to zoom in on a section of a figure, does not work in bird's-eye plot figures.
More About
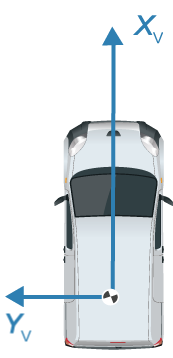
The birdsEyePlot uses the vehicle coordinate
system (XV,
YV), where:
The XV-axis points forward from the ego vehicle.
The YV-axis points to the left, as viewed when facing forward.
The origin is at the center of rotation of the ego vehicle. This point is on the road surface, beneath the center of the rear axle of the ego vehicle.
For more details about the vehicle coordinate system, see Coordinate Systems in Automated Driving Toolbox.
Version History
Introduced in R2017a