fitToView
R2026bDescription
fitToView( automatically adjusts
the y-axis limits of all displays of the
scope)timescope object to fit the currently displayed data.
The function does not consider historic data outside the current time span or zoom level.
The fitToView function performs a one‑time autoscaling
operation without changing the YLimitsMode property of the
timescope object and is useful for resetting the view or
updating y-axis limits on demand.
If you set YLimitsMode to "auto" or
"auto-expand", the scope continues to automatically adjust
limits as new data arrives. If you set YLimitsMode to
"manual" and to make a one-time adjustment of the
y-axis limits without switching to continuous autoscaling,
use the fitToView object function.
fitToView(
adjusts the y-axis limits of the specified display only.scope,displayIndex)
Examples
The timescope object requires one of these products:
DSP System Toolbox™
Navigation Toolbox™
Sensor Fusion and Tracking Toolbox™
Create a timescope object. Set the YLimitsMode property to "manual", manual y-axis limits to [-1 1], and sample rate to 1000 Hz.
scope = timescope(YLimitsMode="manual",YLimits=[-1 1],SampleRate=1000);Stream in random data and view the data using the time scope. The data has a standard deviation of 1 and therefore some values exceed the manual y-axis limits.
for idx = 1:100
    scope(randn(1000,1));
end
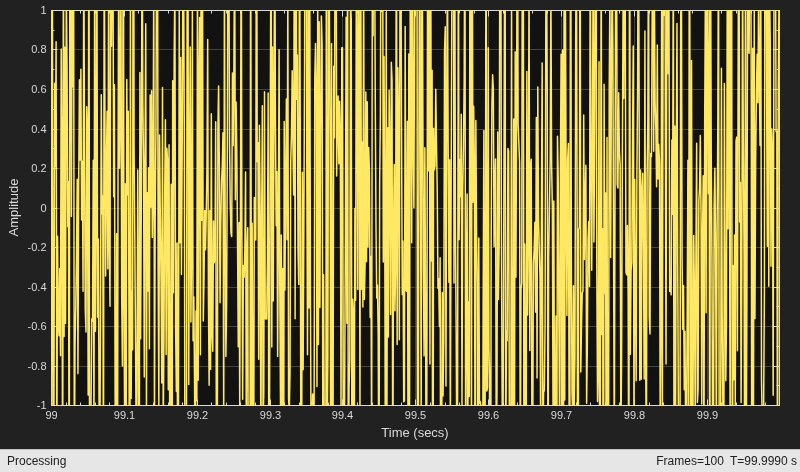
Fit the y-axis limits to the currently displayed data. The fitToView function performs a one-time autoscaling operation without changing the YLimitsMode property.
fitToView(scope)
The timescope object requires one of these products:
DSP System Toolbox™
Navigation Toolbox™
Sensor Fusion and Tracking Toolbox™
Create a timescope object with a sample rate of 1000 Hz and a 2-by-1 layout.
scope = timescope(SampleRate=1000,LayoutDimensions=[2 1]);
Stream two channels of random data into the scope.
scope(randn(1000,1),randn(1000,1));
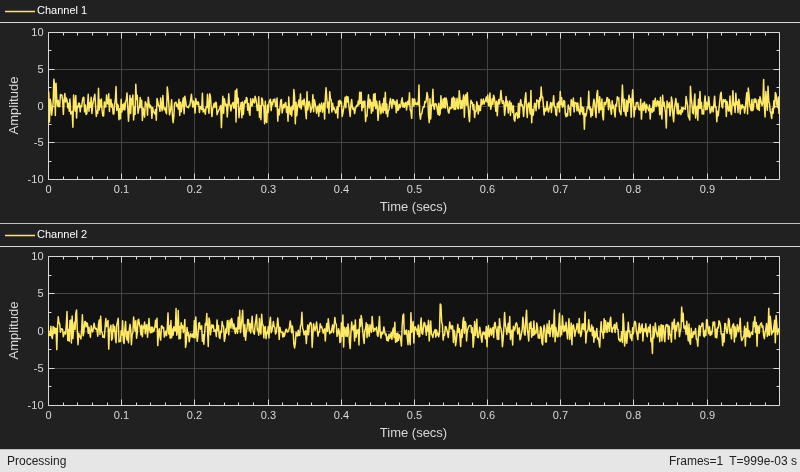
Fit the y-axis limits of the second display only by specifying a display index of 2.
fitToView(scope,2);
Input Arguments
Version History
Introduced in R2026b

