Main Content

instrumentCode

Add instrumentation to generated code to perform execution time / memory usage profiling and analyze code coverage

Since R2023a

    Description

    instrumentCode(buildFolder) generates a SIL or PIL MEX function for the code generation files located in buildFolder that you already produced by using the codegen command. The generated MEX does not contain any additional instrumentation.

    example

    instrumentCode(___,Name=Value) enables you to include additional instrumentation in the SIL or PIL MEX that you generate using the previous syntax. Provide one or more name-value arguments to specify the instrumentation that you intend to include in the generated MEX. You can add instrumentation to track stack memory usage, analyze C/C++ code coverage, profile entry-point functions, or profile functions called within entry-point functions. You can also use instrumentCode to specify the toolchain to use to build the generated code, and compiler optimization and debug settings for the specified toolchain.

    The instrumentCode function decouples the code generation and code instrumentation steps. This functionality enables you to analyze the execution behavior of the code you intend to deploy without altering the original functional code. Once you generate the code, you can apply the instrumentation as many times as you need.

    Examples

    collapse all

    This example shows how to use the instrumentCode function to add instrumentation for C/C++ coverage analysis to code that you already generated by using the codegen command. To perform coverage analysis, you need a MATLAB® Test™ license.

    Define Entry-Point Function and Generate Code

    Define a MATLAB entry-point function coverageAnalysisExample that performs a binary operation on its first two inputs. The binary operation depends on whether the third input is positive, negative, or zero.

    type coverageAnalysisExample
    function out = coverageAnalysisExample(A,B,flag) %#codegen
    if flag > 0
        out = A + B;
    elseif flag < 0
        out = A - B;
    else
        out = A * B;
    end
    end
    

    Generate static library code for software-in-the-loop (SIL) execution. Specify all inputs to be of scalar double type. Specify the name of the code generation folder to be my_codegen_folder.

    cfg = coder.config('lib');
    cfg.VerificationMode = 'SIL';
    codegen -config cfg coverageAnalysisExample -args {0,0,0} -d my_codegen_folder
    Code generation successful.
    

    Add Instrumentation to Generated Code

    Add C/C++ code coverage instumentation to the generated code and produce an instrumented MEX.

    instrumentCode('my_codegen_folder', 'CodeCoverage', true)
    Completed instrumentation of generated code.
    

    Execute the MEX and View Coverage Data

    Execute coverageAnalysisExample_sil with two sets of sample inputs. Make sure the third input is positive for one set and negative for the other.

    coverageAnalysisExample_sil(10,4,3)
    ### Starting SIL execution for 'coverageAnalysisExample'
        To terminate execution: clear coverageAnalysisExample_sil
    
    ans = 14
    
    coverageAnalysisExample_sil(10,4,-2)
    ans = 6
    

    Terminate SIL execution and view the code coverage report.

    clear coverageAnalysisExample_sil
    ### Application stopped
    ### Stopping SIL execution for 'coverageAnalysisExample'
        Code coverage report: getCodeCoverageData('coverageAnalysisExample_sil')
    
    getCodeCoverageData('coverageAnalysisExample_sil');

    code_coverage.png

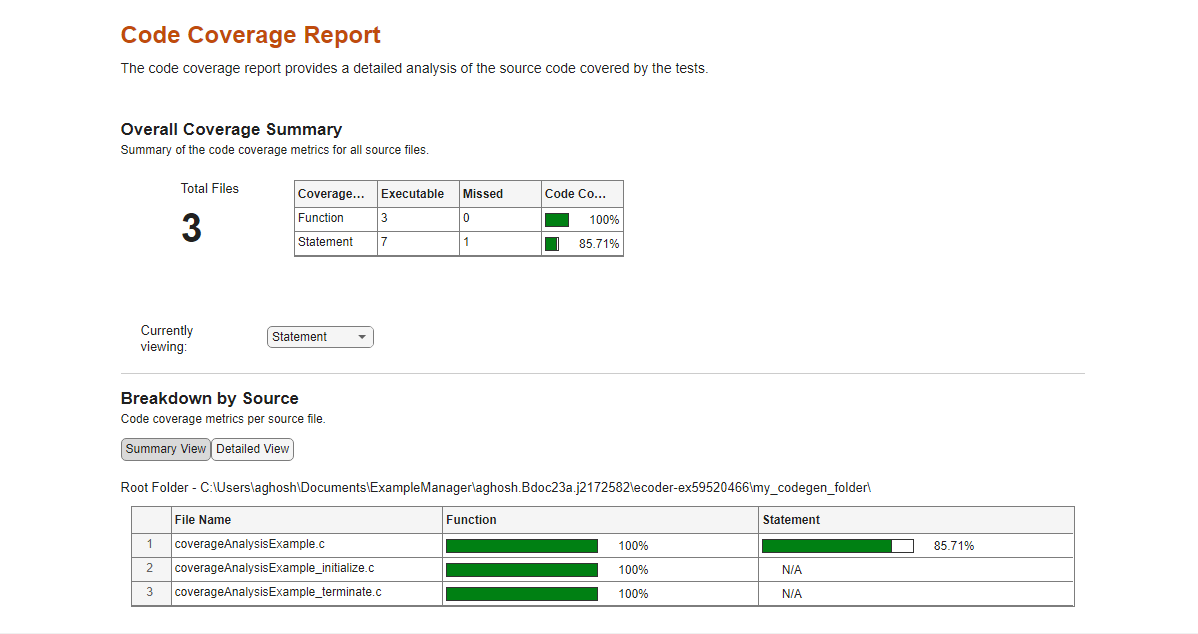
    Because neither of your test runs had the third input argument equal to zero, the last branch of the if-else block was never executed in the generated C entry-point file coverageAnalysisExample.c. This caused the coverageAnalysisExample.c file to have less than 100% statement coverage.

    Input Arguments

    collapse all

    Absolute or relative path to the folder that contains the code generation files. This is the folder path that you specify with the -d flag when using the codegen command.

    Example: "my_codegen_folder"

    Data Types: char | string

    Name-Value Arguments

    Specify optional pairs of arguments as Name1=Value1,...,NameN=ValueN, where Name is the argument name and Value is the corresponding value. Name-value arguments must appear after other arguments, but the order of the pairs does not matter.

    Before R2021a, use commas to separate each name and value, and enclose Name in quotes.

    Example: instrumentCode("my_codegen_folder", CodeExecutionProfiling = true, CodeProfilingInstrumentation = true)

    Note

    These name-value pair arguments, except BuildMethod, are also available as properties in the coder.EmbeddedCodeConfig object. The instrumented MEX generated by using the instrumentCode function has the same behavior as the MEX generated with the corresponding code configuration settings and the codegen command.

    Specify whether you want to generate MEX for software-in-the-loop (SIL) or processor-in-the-loop (PIL) execution.

    Data Types: char | string

    Stack usage profiling of entry-point functions during a software-in-the-loop (SIL) or processor-in-the-loop (PIL) execution, specified as one of the values in this table.

    ValueDescription
    false

    This value is the default value.

    Disables stack usage profiling during a SIL or PIL execution.

    trueInstruments generated code to calculate stack usage of functions in the SIL or PIL execution. Use the Code Profile Analyzer to view the stack usage values for entry-point and internal functions.

    Data Types: logical

    Coverage analysis of both generated C/C++ code and custom C/C++ during a software-in-the-loop (SIL) or processor-in-the-loop (PIL) execution, specified as one of the values in this table.

    ValueDescription
    false

    This value is the default value.

    Disables code coverage analysis during a SIL or PIL execution.

    trueInstruments C/C++ code for coverage analysis in the SIL or PIL application.

    To use this name-value argument, you must have a MATLAB® Test™ license.

    Data Types: logical

    Execution-time profiling of entry-point functions during a software-in-the-loop (SIL) or processor-in-the-loop (PIL) execution, specified as one of the values in this table.

    ValueDescription
    false

    This value is the default value.

    Disables execution-time profiling during a SIL or PIL execution.

    trueInstruments generated code to calculate execution times of entry-point functions in the SIL or PIL execution. Use the Code Profile Analyzer to view the call tree and corresponding execution times for the generated code.

    Data Types: logical

    Execution-time profiling of functions that are called within entry-point functions during a software-in-the-loop (SIL) or processor-in-the-loop (PIL) execution, specified as one of the values in this table.

    ValueDescription
    false

    This value is the default value.

    Disables execution-time profiling of functions called within entry-point functions during a SIL or PIL execution.

    true

    Instruments generated code to calculate execution times of functions called within entry-point functions in the SIL or PIL execution. Use the Code Profile Analyzer to view the call tree and corresponding execution times for the generated code.

    Data Types: logical

    Options for collection and storage of execution-time measurements, specified as one of the values in this table.

    ValueDescription
    "AllData"

    This value is the default value.

    As execution runs, collects and immediately uploads profiling measurement and analysis data from target device to development computer. At the end of execution, saves all data in base workspace.

    "SummaryOnly"

    As execution runs, evaluates only execution-time metrics required for report and immediately uploads metrics from target device. At the end of execution, saves evaluated metrics in base workspace.

    "MetricsOnly"

    As execution runs, processes profiling data and stores certain metrics on target device. At the end of execution, uploads the stored metrics from target device.

    Data Types: char | string

    Toolchain that you want to use to build the generated code. If you specify an empty string or character vector, the generated code is built using the original settings.

    Data Types: char | string

    Compiler optimization or debug settings for toolchain, specified as one of the values in this table.

    ValueDescription
    ""

    Compiler optimization and debug settings are not set.

    "Faster Builds"

    Optimizes the build for shorter build times.

    "Faster Runs"

    Optimizes the build for faster running executables.

    "Debug"

    Optimizes the build for debugging.

    "Specify"

    Enables you to specify options for toolchain.

    Data Types: char | string

    Version History

    Introduced in R2023a