cusumtest
Cusum test for structural change
Syntax
Description
h = cusumtest(Tbl)ResponseVariable name-value
argument. To select different predictor variables, use the
PredictorNames name-value argument.
h = cusumtest(___,Name=Value)cusumtest conducts multiple tests:
cusumtesttreats each test as separate from all other tests.All outputs expand their singleton dimension to contain results from each test.
For example, cusumtest(Tbl,ResponseVariable="RGDP",Test=["cusum"
cusumsq"]) conducts two cusum tests using GDP
as the response variable in the regressions and all other variables in the table
Tbl as predictors. The first test uses the cusum test
statistic and the second test uses the cusum of squares test statistic.
[
also returns the following decision statistics from conducting a cusum test,
using any input-argument combination in the previous syntaxes:h,H,Stat,W,B]
= cusumtest(___)
h, the test decisionH, the sequence of decisions for each iteration of the testStat, the sequence of test statisticsW, the sequence of recursive residualsB, the sequence of coefficient estimates
cusumtest(___) plots both the sequence of
cusums and the critical lines resulting from the cusum tests.
cusumtest(
plots on the axes specified by ax,___)ax instead of
the current axes (gca). ax can precede any of the input
argument combinations in the previous syntaxes.
[___,
additionally returns handles to plotted graphics objects. Use elements of
sumPlots]
= cusumtest(___)sumPlots to modify properties of the plot after you
create it.
Examples
Conduct a cusum test to assess whether there is a structural break in the equation for food demand. Input the predictor series as a matrix and input the response series as a vector.
Load the US food consumption data set Data_Consumption.mat, which contains annual measurements from 1927 through 1962 with missing data due to World War II in the matrix Data.
load Data_ConsumptionSuppose that you want to develop a model for consumption as determined by food prices and disposable income, and assess its stability through the economic shock through the war.
Plot the series.
P = Data(:,1); % Food price index
I = Data(:,2); % Disposable income index
Q = Data(:,3); % Food consumption index

figure;
plot(dates,[P I Q])
axis tight
grid on
xlabel("Year")
ylabel("Index")
legend(["Price" "Income" "Consumption"],Location="southeast")
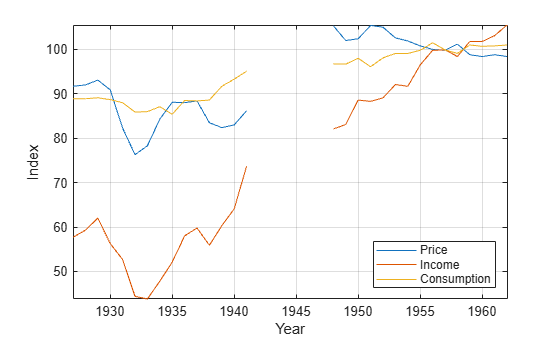
Measurements are missing from 1942 through 1947, which correspond to WWII.
Stabilize each series by applying the log transformation.
LP = log(P);
LI = log(I);
LQ = log(Q);
Assume that log consumption is a linear function of the logs of food price and income.
is a Gaussian random variable with mean 0 and standard deviation .
Identify the indices before WWII. Plot log consumption with respect to the logs of food price and income.
preWarIdx = (dates <= 1941);

figure
scatter3(LP(preWarIdx),LI(preWarIdx),LQ(preWarIdx),[],"ro");
hold on
scatter3(LP(~preWarIdx),LI(~preWarIdx),LQ(~preWarIdx),[],"b*");
legend(["Pre-war observations" "Post-war observations"], ...
    Location="best")
xlabel("Log Price")
ylabel("Log Income")
zlabel("Log Consumption")

% Obtain better view
h = gca;
h.CameraPosition = [4.3 -12.2 5.3];
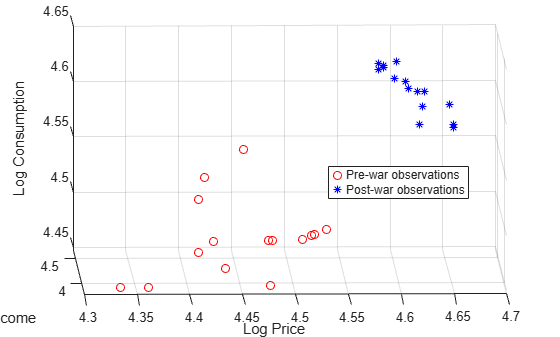
Data relationships appear to be affected by the war.
Conduct a cusum test to assess whether there is a significant structural change. Use default values.
X = [LP LI];
y = LQ;
h = cusumtest(X,y)
h = logical
   0
h = 0 indicates that there is not enough evidence to reject the null hypothesis that the coefficients are equal across subsamples.
Conduct a cusum test to assess whether there is a structural change in the equation for food demand, where the time series are variables in a table.
Load the US food consumption data set Data_Consumption.mat, which contains annual measurements from 1927 through 1962 with missing data due to World War II in the table DataTable. Convert the table to a timetable, and remove rows containing missing values.
load Data_Consumption
dates = datetime(dates,12,31);
TT = table2timetable(DataTable,RowTimes=dates);
TT.Row = [];
TT = rmmissing(TT);
Apply the log transform to all variables in the table.
LogTT = varfun(@log,TT);
LogTT.Properties.VariableNames
ans = 1×3 cell
    {'log_P'}    {'log_I'}    {'log_Q'}
Conduct a cusum test to assess whether there is a structural change in the regression model of log food consumption log_Q on log price log_P and log income log_I.
h = cusumtest(LogTT)
h = logical
   0
By default, chowtest selects the last table variable as the response, and selects all other variables as predictors. You can select a different variable by using the ResponseVariable name-value argument, and you can choose a different set of predictor variables by using the PredictorVariables name-value argument.
Load the US food consumption data set Data_Consumption.mat. Consider a model for log food consumption as determined by log food prices and log disposable income.
load Data_Consumption
LogDT = varfun(@log,DataTable);
numObs = height(LogDT) - sum(any(ismissing(LogDT),2))
numObs = 30
numPreds = width(LogDT) - 1
numPreds =
2
Conduct a cusum test using default values. Return all test decision statistics.
[h,H,Stat,W] = cusumtest(LogDT)
h = logical
   0
H=1×28 table
               H1       H2       H3       H4       H5       H6       H7       H8       H9       H10      H11      H12      H13      H14      H15      H16      H17      H18      H19      H20      H21      H22      H23      H24      H25      H26      H27      H28
              _____    _____    _____    _____    _____    _____    _____    _____    _____    _____    _____    _____    _____    _____    _____    _____    _____    _____    _____    _____    _____    _____    _____    _____    _____    _____    _____    _____

    Test 1    false    false    false    false    false    false    false    false    false    false    false    false    false    false    false    false    false    false    false    false    false    false    false    false    false    false    false    false
Stat=1×28 table
              Stat1      Stat2       Stat3       Stat4       Stat5       Stat6       Stat7      Stat8      Stat9     Stat10     Stat11     Stat12      Stat13     Stat14    Stat15    Stat16    Stat17    Stat18    Stat19    Stat20    Stat21    Stat22    Stat23    Stat24    Stat25    Stat26      Stat27      Stat28
              _____    _________    ________    ________    ________    ________    _______    _______    _______    _______    ______    ________    ________    ______    ______    ______    ______    ______    ______    ______    ______    ______    ______    ______    ______    _______    ________    ________

    Test 1     NaN     -0.012438    0.064511    -0.50784    -0.55747    -0.42687    -2.7881    -3.0973    -3.7625    -3.5417    -1.913    -0.65794    -0.35743    2.3762    3.3104    3.7509    2.8851    3.7395    4.2295    4.641     4.2412    4.496     3.2467    2.0001    1.5324    0.81729    0.053352    -0.98812
W=1×28 table
              W1         W2             W3            W4            W5            W6           W7            W8            W9           W10         W11         W12         W13         W14          W15          W16          W17           W18          W19          W20          W21           W22          W23          W24          W25           W26           W27           W28
              ___    ___________    __________    __________    ___________    _________    _________    __________    __________    _________    ________    ________    ________    ________    _________    _________    __________    _________    _________    _________    __________    _________    _________    _________    __________    __________    __________    _________

    Test 1    NaN    -0.00012823    0.00079327    -0.0059004    -0.00051169    0.0013464    -0.024342    -0.0031882    -0.0068572    0.0022762    0.016791    0.012938    0.003098    0.028181    0.0096305    0.0045417    -0.0089262    0.0088086    0.0050515    0.0042415    -0.0041209    0.0026269    -0.012879    -0.012851    -0.0048219    -0.0073721    -0.0078755    -0.010737
cusumtest returns the overall rejection decision h, and tables containing the sequence of rejection decision from the forward recursions of the cusum test H, the corresponding sequence of test statistics Stat, and the corresponding recursive residuals W. Each table contains numObs - numPreds + Intercept = 28 variables corresponding to results of each recursion in the cusum test. Stat1 = W1 = NaN indicates the presence of a model intercept.
Determine whether an explanatory model of real gross national product (RGNP) is stable by plotting recursive residuals.
Load the Nelson-Plosser data set Data_NelsonPlosser.mat, which contains the table of data DataTable.
load Data_NelsonPlosserThe time series in the data set contain annual, macroeconomic measurements from 1860 to 1970. For more details, a list of variables, and descriptions, enter Description in the command line.
Convert the table to a timetable. Focus the sample to measurements from the end of 1915 through the end of 1970.
dates = datetime(dates,12,31);
span = isbetween(dates,datetime(1915,12,31),datetime(1970,12,31),"closed");
TT = table2timetable(DataTable,RowTimes=dates);
TT.Dates = [];
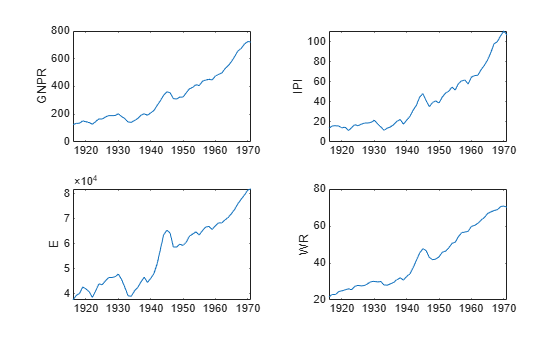
TT = TT(span,:);Consider a predictive model of the US RGNP GNPR given measurements of the industrial production index IPI, total employment E, and real wages WR.
Plot the series in the model.
prednames = ["IPI" "E" "WR"];

tiledlayout(2,2)
for j = ["GNPR" prednames]
    nexttile
    plot(TT.Time,TT{:,j})
    ylabel(j)
end
To address exponential growth, apply the log transform to the series.
LogTT = varfun(@log,TT);
LogTT is a timetable containing the transformed variables in TT, but with names prepended with log_.
Assume that an appropriate multiple regression model to describe real GNP is
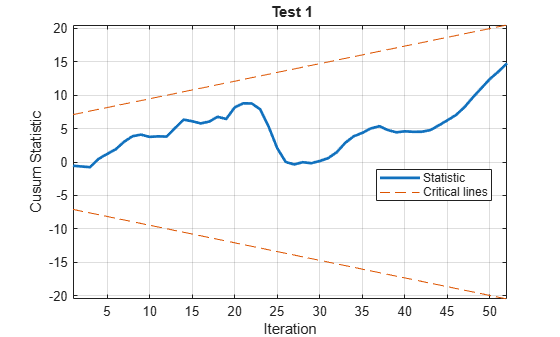
Conduct a cusum test to assess whether all regression coefficients are stable. Print a test summary to the command line. Plot the test statistics.
lprednames = "log_" + prednames;
cusumtest(LogTT,ResponseVariable="log_GNPR", ...
    PredictorVariables=lprednames,Display="summary")
RESULTS SUMMARY

***************
Test 1

Test type: cusum
Test direction: forward
Intercept: yes
Number of iterations: 52

Decision: Fail to reject coefficient stability
Significance level: 0.0500
ans = logical
   0
The cusum series does not cross the critical lines, which indicates model stability.
Conduct cusum tests to assess whether there are structural changes in the equation for food demand around World War II. Implement forward and backward recursive regressions to obtain the test statistics.
Load the US food consumption data set Data_Consumption.mat, which contains annual measurements from 1927 through 1962 with missing data due to the World War II in the table DataTable. Convert the table to a timetable, and remove rows containing missing values.
load Data_Consumption
dates = datetime(dates,12,31);
TT = table2timetable(DataTable,RowTimes=dates);
TT.Row = [];
TT = rmmissing(TT);
Consider a model for log food consumption as determined by log food prices and log disposable income, and assess its stability through the economic shock through the war.
Apply the log transform to all variables in the table.
LogTT = varfun(@log,TT);
Conduct forward and backward cusum tests using a 5% level of significance for each test. Plot the cusums. Return the recursive residuals.
[h,~,~,W] = cusumtest(LogTT,Direction=["forward" "backward"], ...
    Plot="on");
RESULTS SUMMARY

***************
Test 1

Test type: cusum
Test direction: forward
Intercept: yes
Number of iterations: 27

Decision: Fail to reject coefficient stability
Significance level: 0.0500
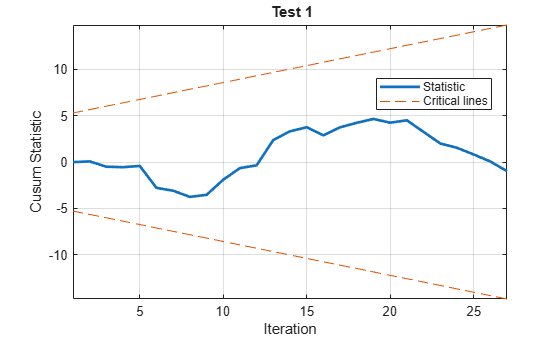
***************
Test 2

Test type: cusum
Test direction: backward
Intercept: yes
Number of iterations: 27

Decision: Fail to reject coefficient stability
Significance level: 0.0500
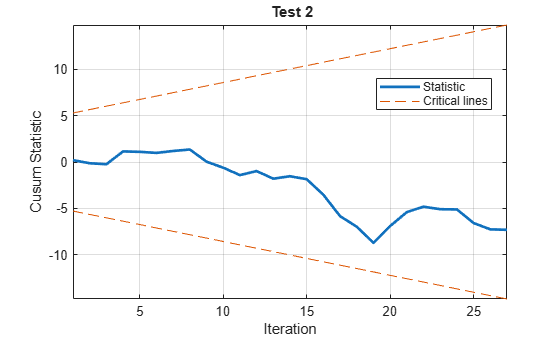
The plots and test results at the command line indicate that neither test rejects the null hypothesis that coefficients are stable.
Compare the results of the cusum tests with the results of a Chow test. Unlike cusum tests, Chow tests require a guess for the time point at which the structural break occurs. Specify that the break point is 1941.
bp = find(LogTT.Time >= datetime(1941,12,31),1);
chowtest(LogTT,bp,Display="summary");
RESULTS SUMMARY *************** Test 1 Sample size: 30 Breakpoint: 15 Test type: breakpoint Coefficients tested: All Statistic: 5.5400 Critical value: 3.0088 P value: 0.0049 Significance level: 0.0500 Decision: Reject coefficient stability
The test results reject the null hypothesis that the coefficients are stable.
The Chow and cusum test results are not consistent. For details on cusum test limitations, see Limitations.
Check whether a cusum of squares test can detect a structural break in volatility in simulated data.
Simulate a series of data from this regression model
is a series of observations from three standard Gaussian predictor variables. and are series of Gaussian innovations both with mean 0 and standard deviation 0.1 and 0.2, respectively.
rng(1); % For reproducibility
T = 100;
X = randn(T,3);
sigma1 = 0.1;
sigma2 = 0.2;
e = [sigma1*randn(T/2,1); sigma2*randn(T/2,1)];
b = (1:3)';
y = X*b + e;
Conduct a cusum of squares test using a 5% level of significance. Plot the test statistics and critical region bands. Indicate that there is no model intercept. Request to return whether the test statistics cross into critical region at each iteration.
[~,H] = cusumtest(X,y,Test="cusumsq",Plot="on", ...
    Direction=["forward" "backward"],Display="off", ...
    Intercept=false);
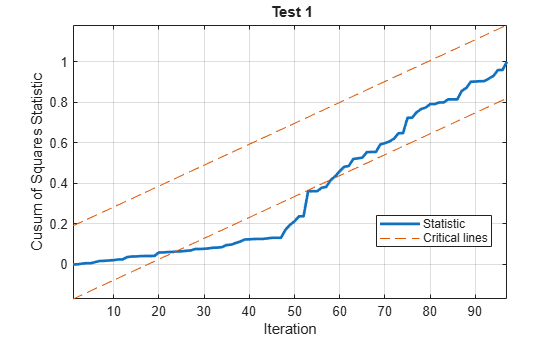
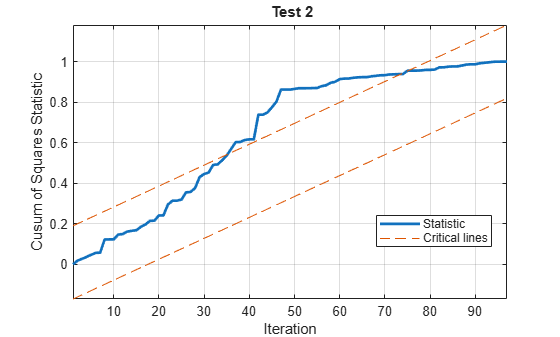
Because the test statistics cross the critical lines at least once for both tests, the tests reject the null hypothesis of constant volatility at 5% level. The test statistics change direction around iteration 50, which is consistent with the simulated break in volatility in the data.
H is a 2-by-97 logical matrix containing the sequence of decisions for each iteration of each cusum of squares test. The first row corresponds to the forward cusum of squares test, and the second row corresponds to the backward cusum of squares test.
For the forward test, determine the iterations that result in the test statistics crossing the critical line.
bp = find(H(1,:) == 1)
bp = 1×35

    24    25    26    27    28    29    30    31    32    33    34    35    36    37    38    39    40    41    42    43    44    45    46    47    48    49    50    51    52    53    54    55    56    57    58
Input Arguments
Name-Value Arguments
Output Arguments
Limitations
Cusum tests have little power to detect structural changes in the following cases.
Late in the sample period
When multiple changes produce cancellations in the cusums
More About
Tips
The cusum of squares test:
Is a “useful complement to the cusum test, particularly when the departure from constancy of the [recursive coefficients] is haphazard rather than systematic” [1]
Has greater power for cases in which multiple shifts are likely to cancel
Is often suggested for detecting structural breaks in volatility
Alphaspecifies the nominal significance levels for the tests. The actual size of a test depends on various assumptions and approximations thatcusumtestuses to compute the critical lines. Plots of the recursive residuals are the best indicator of structural change. Brown, et al. suggest that the tests “should be regarded as yardsticks for the interpretation of data rather than leading to hard and fast decisions” [1].To produce basic diagnostic plots of the recursive coefficient estimates having the same scale for test
n, enterplot(B(:,:,n)')
recregproduces similar plots, optionally using robust standard error bands.
Algorithms
cusumtesthandles initially constant predictor data using the method suggested in [1]. If a predictor's data is constant for the firstnumCoeffsobservations and this results in multicollinearity with an intercept or another predictor, thencusumtestdrops the predictor from regressions and the computation of recursive residuals until its data changes. Similarly,cusumtesttemporarily holds out terminally constant predictors from backward regressions. Initially constant predictors in backward regressions, or terminally constant predictors in forward regressions, are not held out bycusumtestand can lead to rank deficiency in terminal iterations.cusumtestcomputes critical lines for inference in essentially different ways for the two test statistics. For cusums,cusumtestsolves the normal CDF equation in [1] dynamically for each value ofAlpha. For the cusums of squares test,cusumtestinterpolates parameter values from the table in [2], using the method suggested in [1]. Sample sizes with degrees of freedom less than 4 are below tabulated values, andcusumtestcannot compute critical lines. Sample sizes with degrees of freedom greater than 202 are above tabulated values, andcusumtestuses the critical value associated with the largest tabulated sample size.
References
[1] Brown, R. L., J. Durbin, and J. M. Evans. "Techniques for Testing the Constancy of Regression Relationships Over Time." Journal of the Royal Statistical Society, Series B. Vol. 37, 1975, pp. 149–192.
[2] Durbin, J. "Tests for Serial Correlation in Regression Analysis Based on the Periodogram of Least Squares Residuals." Biometrika. Vol. 56, 1969, pp. 1–15.
Version History
Introduced in R2016aSee Also
recreg | fitlm | LinearModel | chowtest