Main Content

adline

Accumulation/Distribution line

Description

example

ADline = adline(Data) calculates the Accumulation/Distribution Line from a set of high, low, closing prices, and volume traded of a security.

Examples

collapse all

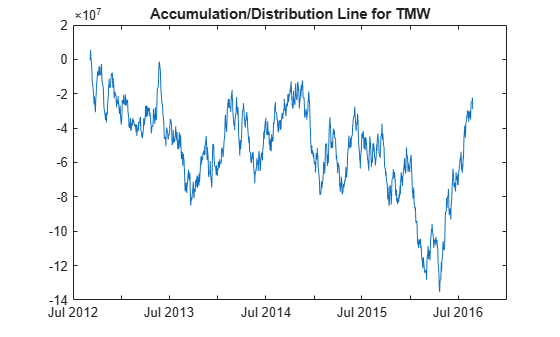
Load the file SimulatedStock.mat, which provides a timetable (TMW) for financial data for TMW stock.

load SimulatedStock.mat
line = adline(TMW);
plot(line.Time,line.ADLine)
title('Accumulation/Distribution Line for TMW')

Input Arguments

collapse all

Data with high, low, closing prices and volume traded, specified as a matrix, table, or timetable. For matrix input, Data is M-by-4 with high, low, closing prices, and volume traded. Timetables and tables with M rows must contain a variable named 'High', 'Low', 'Close', and 'Volume' (case insensitive).

Data Types: double | table | timetable

Output Arguments

collapse all

Accumulation/Distribution line, returned with the same number of rows (M) and the same type (matrix, table, or timetable) as the input Data.

References

[1] Achelis, S. B. Technical Analysis from A to Z. Second Edition. McGraw-Hill, 1995, pp. 52–53.

Version History

Introduced before R2006a

expand all