Main Content

plotfis

Display fuzzy inference system

Description

plotfis(fis) displays a high-level diagram of a fuzzy inference system (FIS).

  • When fis is a Mamdani or Sugeno FIS, the center of the display shows the name, type, and rule count for the FIS. The input variables with their associated membership functions display on the left, and the outputs with their associated membership functions display on the right.

  • When fis is a FIS tree, the display shows the inputs, outputs, component FIS objects, and connections of the specified FIS tree.

example

plotfis(fis,Name=Value) configures display properties using one or more name-value arguments.

example

Examples

collapse all

Create a fuzzy inference system (FIS). For this example, read the FIS from the tipper.fis file.

fis = readfis("tipper");

Display the fuzzy system.

plotfis(fis)

Figure contains 5 axes objects. Axes object 1 with xlabel service (3) contains 3 objects of type line. Axes object 2 with xlabel food (2) contains 2 objects of type line. Axes object 3 with xlabel tip (3) contains 3 objects of type line. Axes object 4 with xlabel tipper (3) contains an object of type text. Hidden axes object 5 with xlabel System tipper: 2 inputs, 1 outputs, 3 rules contains 3 objects of type line.

The figure shows:

  • The FIS name, type, and number of rules

  • The name and membership function configuration for each input and output variable

Since R2021b

Load a FIS tree for a weighted tipper system with three inputs and one output.

load("weightedTipper")

Display the fistree object with a legend.

plotfis(weightedTipper,Legend="on")

Figure FIS Tree Plot: weightedTipper contains an axes object. The axes object contains 27 objects of type line, text, patch. These objects represent Free or intermediate outputs, Free inputs, Connections, Joints.

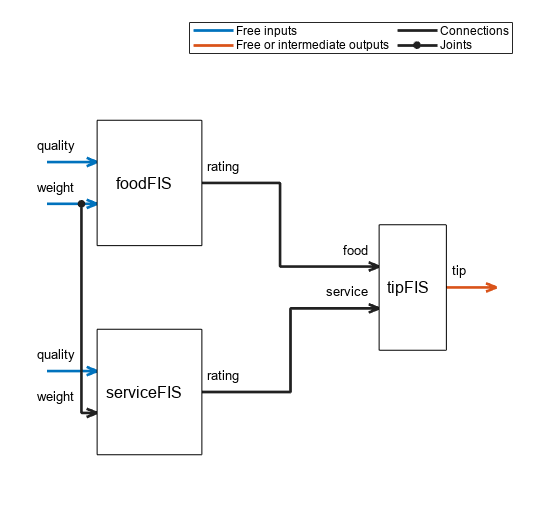
In this display, free inputs are the inputs without any incoming connections. You must specify these inputs when you evaluate the FIS tree. The software returns the free and intermediate output values when you evaluate the FIS tree.

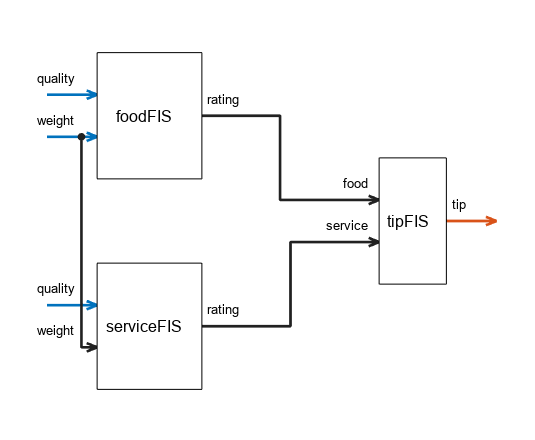
You can also plot the FIS tree without a legend.

plotfis(weightedTipper)

Figure FIS Tree Plot: weightedTipper contains an axes object. The axes object contains 27 objects of type line, text, patch. These objects represent Free or intermediate outputs, Free inputs, Connections, Joints.

Since R2024b: To further analyze the intermediate FIS behavior, you can view the data propagation through the system for specified input values. For example, view the propagation of inference results for a food quality rating of 8, service quality rating of 3, and weighting factor of 0.2.

plotfis(weightedTipper,SimulationInputs=[8 0.2 3])

Figure FIS Tree Plot: weightedTipper contains an axes object. The axes object contains 27 objects of type line, text, patch. These objects represent Free or intermediate outputs, Free inputs, Connections, Joints.

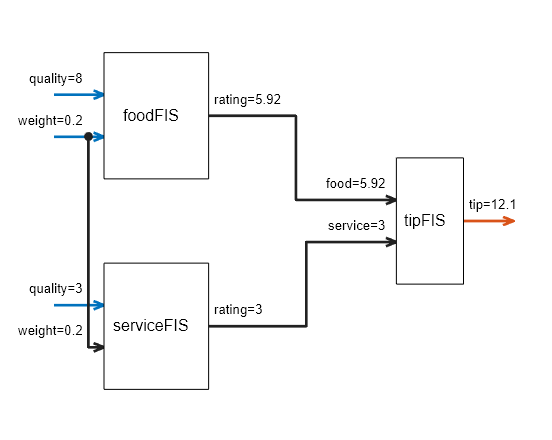
The plot shows the intermediate inference results. For example, the foodFIS system reduces the food rating based on the weighting factor.

Input Arguments

collapse all

Fuzzy inference system, specified as one of these objects:

  • mamfis — Mamdani fuzzy inference system

  • sugfis — Sugeno fuzzy inference system

  • mamfistype2 — Type-2 Mamdani fuzzy inference system

  • sugfistype2 — Type-2 Sugeno fuzzy inference system

  • fistree — Tree of interconnected fuzzy inference systems (since R2021b)

Name-Value Arguments

collapse all

Specify optional pairs of arguments as Name1=Value1,...,NameN=ValueN, where Name is the argument name and Value is the corresponding value. Name-value arguments must appear after other arguments, but the order of the pairs does not matter.

Example: plotfis(fisT,Legend="on") displays a legend in the plot of FIS tree fisT.

Since R2021b

Option to display a legend for the FIS tree plot, specified as "off" or "on". When Legend is "on", the FIS plot displays information about the inputs, outputs, and connections of the specified fistree object by adding a legend to the display.

Dependencies

This argument applies only when fis is a fistree object.

Since R2024b

Input values for evaluating the FIS, specified as a vector with length equal to the number of inputs in fis. When you specify SimulationInputs, the FIS plot displays the propagation of inference results through fis for the specified input values.

Since R2024b

Number of sample points for output defuzzification when , specified as an integer greater than 1.

Dependencies

This argument is ignored when SimulationInputs is empty.

Alternative Functionality

App

You can interactively view the high-level structure of a FIS using the Fuzzy Logic Designer app.

Version History

Introduced before R2006a

expand all