Residential Ground Source Heat Pump
This example models a ground source heat pump system that is used to heat a residential building having hot-water radiators for heat distribution. The ground source heat pump uses R410a, a two-phase fluid refrigerant, as the working fluid. The heat pump takes up the naturally existing heat stored in the ground and transfers the heat to the hot-water radiators. The compressor drives the refrigerant through a condenser, a thermostatic expansion valve, and an evaporator. An accumulator ensures that only vapor returns to the compressor. A receiver ensures that only liquid returns to the thermostatic expansion valve.
The ground acts as a heat source during winters. A series of connected pipes, known as ground loop, is buried horizontally in the ground at a shallow depth near the residential building. It circulates a mixture of water and antifreeze that absorbs heat from the surrounding soil. The antifreeze used in this example is Propylene glycol which is considered to be non-toxic. A ground loop pump drives the mixture of water and antifreeze through the header pipes, the ground loop pipes and the evaporator. A circulation pump drives water flow through the condenser. The hot water exiting the condenser is stored in a hot water storage tank. A distribution pump drives the hot water flow from the tank to the radiators. A PI controller modulates the mass flow rate of refrigerant and hot water to circulation pump and distribution pump. The controller keeps the average air temperature of the building around the 23 degC setpoint while responding to ambient temperature variation between -1 degC to 11 degC. The ground temperature varies between 8 degC to 12 degC.
The residential building has four radiators and four rooms. Each room exchanges heat with the environment through its exterior walls, roof, and windows. Each path is simulated as a combination of a thermal convection, thermal conduction, and the thermal mass. It is assumed that heat is not transferred internally between rooms. The initial indoor temperature of the rooms is equal to the ambient temperature of 5 degC and the initial ground temperature is equal to 10 degC. The heat pump quickly increases the average indoor temperature to the setpoint temperature of 23 degC.
This example can be used to keep the average air temperature of the building up to the setpoint temperature of 28 degC while the ambient temperature varies between -1 degC to 11 degC and the ground temperature varies between 8 degC to 12 degC.
Model

House Thermal Network Subsystem

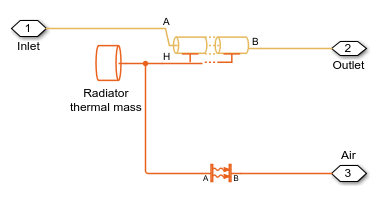
Radiator Subsystem
Room Subsystem

Controller Subsystem
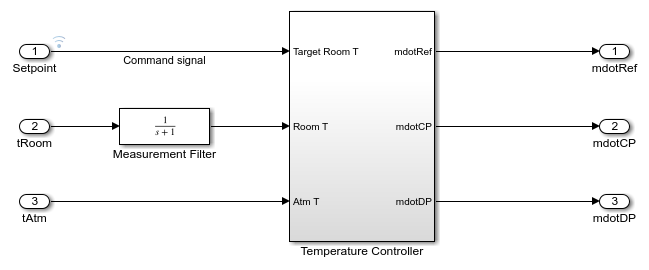
Temperature Controller Subsystem

Ground Environment Subsystem
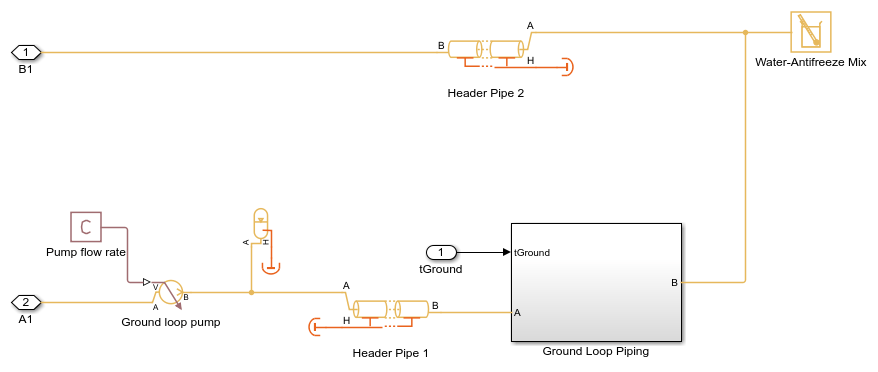
Ground Loop Piping Subsystem

Simulation Results from Scopes

Simulation Results from Simscape Logging
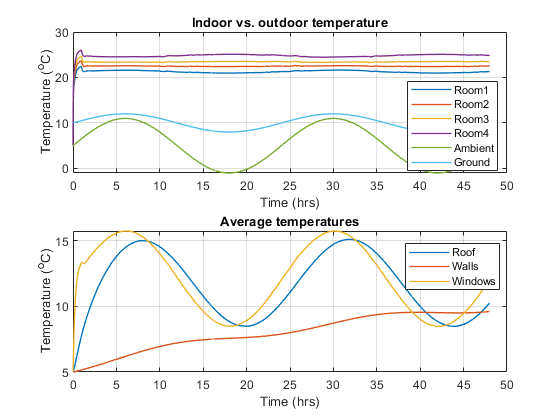
This model can be used to plot temperature variation of indoors and outdoors using ResidentialGroundSourceHeatPumpPlot1T script. This top subplot shows the temperature variation of each room compared to the outside air and ground temperature fluctuations. This bottom subplot shows the average overall temperatures of roof, walls, and windows. The initial indoor temperature of the rooms is equal to the ambient temperature of 5 degC, and the heat pump quickly increases the average indoor temperature to the setpoint temperature of 23 degC. The initial ground temperature is equal to 10 degC.
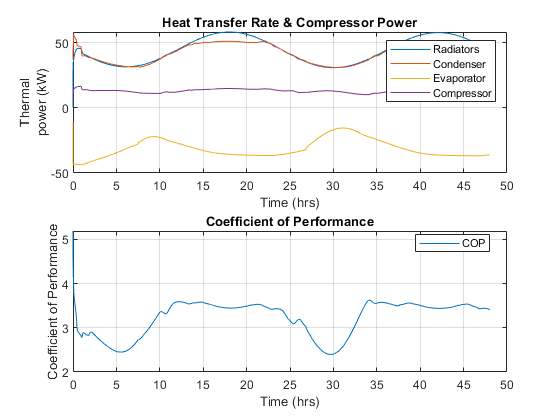
This model can be used to plot power consumption and heat load of different components of the heat pump using ResidentialGroundSourceHeatPumpPlot2Energy script. This top subplot shows the power consumed by the compressor, the heating load of the heat pump system, which is the rate of heat transfer in the condenser, and the rate of heat transfer in the evaporator. This bottom subplot shows coefficient of performance which is the ratio of the heating load and the power consumed. These plots show that more energy is being consumed when heat load is higher, i.e. when ambient temperature is lower, and less energy is being consumed when heat load is lower, i.e. when ambient temperature is higher, while the coefficient of performance stays nearly constant for the entire duration.
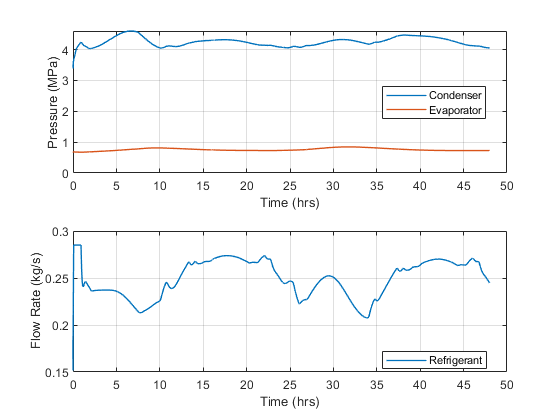
This model can be used to plot pressure and flow variation of the refrigerant using ResidentialGroundSourceHeatPumpPlot3PMdot script. This top subplot shows refrigerant pressure at the condenser and at the evaporator and this bottom subplot shows refrigerant mass flow rate. The higher pressures and flow rates correspond to lower ambient temperatures, when the heat pump needs to transfer more heat, while the lower pressure and flow rates correspond to higher ambient temperatures, when the heat pump needs to transfer less heat.