measureColor
Measure color reproduction using test chart
Syntax
Description
esfrChart or colorChecker Object
Use an esfrChart or a colorChecker object when
you want to automatically detect the color regions of interest (ROIs) of a test
chart. The esfrChart object supports the Enhanced or Extended
version of the Imatest® eSFR test chart [1]. The
esfrChart object supports the Calibrite ColorChecker® Classic test chart [2].
colorValues = measureColor(chart)
[
also returns a color correction matrix computed using a linear least squares
fit.colorValues,colorCorrectionMatrix] = measureColor(chart)
Test Chart Image (since R2024a)
Use a test chart image for other types of test charts that are not supported by
the esfrChart or colorChecker objects. You must
identify the positions of the color ROIs.
colorValues = measureColor(im,roiPositions,refLAB)roiPositions for test chart image
im. The reference L*a*b* values of each ROI are given
by refLAB.
colorValues = measureColor(im,roiPositions,refLAB,Name=Value)
[
also returns a color correction matrix computed using a linear least squares
fit, using any combination of input arguments from previous syntaxes.colorValues,colorCorrectionMatrix] = measureColor(___)
Examples
Read an image of an eSFR chart into the workspace.
I = imread("eSFRTestImage.jpg");Create an esfrChart object, then display the chart with ROI annotations. The 16 color patch ROIs are labeled with white numbers.
chart = esfrChart(I);
displayChart(chart,displayEdgeROIs=false, ...
    displayGrayROIs=false,displayRegistrationPoints=false)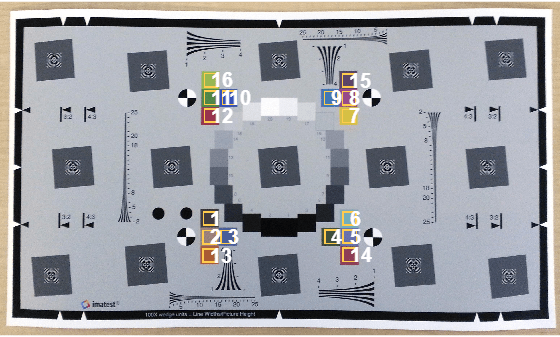
Measure the color in all color patch ROIs.
colorTable = measureColor(chart)
colorTable=16×8 table
    ROI    Measured_R    Measured_G    Measured_B    Reference_L    Reference_a    Reference_b    Delta_E
    ___    __________    __________    __________    ___________    ___________    ___________    _______

     1         67            57            58          38.586           7.541         7.0812       15.15
     2        156           127           122          62.182          13.225         13.826      9.8745
     3         73            95           152          49.369        -0.51463        -20.062      18.455
     4         62            79            58          43.926         -6.8587         17.278      14.849
     5        104           109           171          53.415           9.457        -22.822       12.99
     6        118           175           187           69.95         -20.889       -0.21752      13.123
     7        214           192            69          78.643          1.8052         67.091      9.2399
     8        154            73           138          46.853          41.998        -17.056      5.1282
     9         62           120           182           51.05         -15.166        -22.416      22.813
    10         55            80           185          40.811          8.7346        -44.265      22.782
    11         79           135            72          55.716         -23.419         28.839      9.4826
    12        152            53            77          42.759          44.167         7.9536      5.4168
    13        169            91            52          58.211           27.58         47.578      15.988
    14        142            63            87          47.012           39.15         8.5453      11.651
    15         91            67           102          40.591          17.951         -9.525      10.897
    16        152           183            80          70.505         -16.318         49.811      10.253
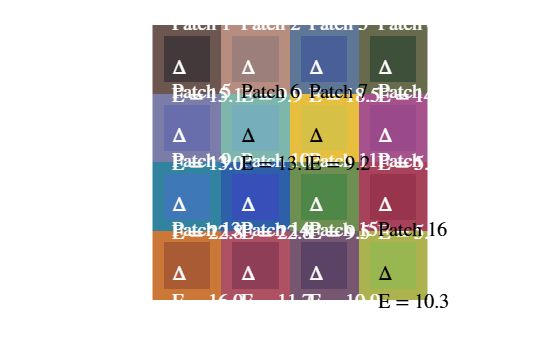
Display the color accuracy measurements. Each square color patch is the measured color, and the thick surrounding border is the reference color for that ROI. Each color accuracy measurement is displayed as Delta_E, the Euclidean distance between measured and reference colors in the CIE 1976 L*a*b* color space. More accurate colors have a smaller Delta_E.
figure
displayColorPatch(colorTable)
For an alternative representation of the color accuracy measurements, plot the measured and reference colors in the CIE 1976 L*a*b* color space on a chromaticity diagram. Red circles indicate the reference color. Green circles indicate the measured color of each color patch. The chromaticity diagram does not portray the brightness of color.
figure
plotChromaticity(colorTable)
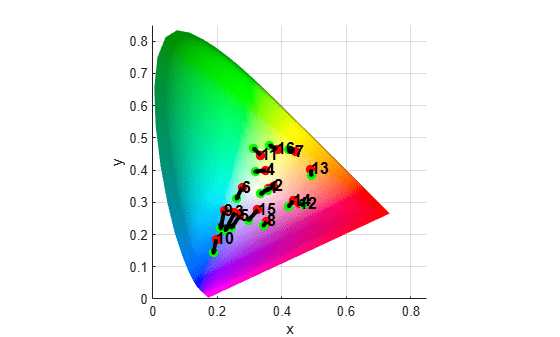
ROIs with a shorter distance between the reference and measurement points have smaller differences in chromaticity, which can contribute to a smaller value of Delta_E. However, brightness also contributes to the value of Delta_E. For example, even though the reference and measurement points for ROI 13 are near each other on the chromaticity diagram, they have a large Delta_E because of their large difference in brightness.
Read an image of a ColorChecker® chart into the workspace.
I = imread("colorCheckerTestImage.jpg");Create a colorChecker object, then display the chart with ROI annotations.
chart = colorChecker(I);
displayChart(chart)

Measure the color in each color patch ROI.
colorTable = measureColor(chart)
colorTable=24×9 table
    ROI         Color          Measured_R    Measured_G    Measured_B    Reference_L    Reference_a    Reference_b    Delta_E
    ___    ________________    __________    __________    __________    ___________    ___________    ___________    _______

     1     {'DarkSkin'    }       160           129           120           37.54          14.37          14.92       20.193
     2     {'LightSkin'   }       229           200           191           64.66          19.27           17.5       22.587
     3     {'BlueSky'     }       146           191           241           49.32          -3.82         -22.54       27.312
     4     {'Foliage'     }       130           161           117           43.46         -12.74          22.72       20.404
     5     {'BlueFlower'  }       175           187           248           54.94           9.61         -24.79       23.073
     6     {'BluishGreen' }       155           232           226           70.48         -32.26          -0.37       18.284
     7     {'Orange'      }       255           161            99           62.73          35.83           56.5       16.114
     8     {'PurplishBlue'}       130           164           254           39.43          10.75         -45.17       28.889
     9     {'ModerateRed' }       252           146           160           50.57          48.64          16.67       23.601
    10     {'Purple'      }       139           118           175            30.1          22.54         -20.87       24.672
    11     {'YellowGreen' }       187           226           110           71.77         -24.13          58.19        15.21
    12     {'OrangeYellow'}       241           194            76           71.51          18.24          67.37       14.148
    13     {'Blue'        }        96           131           255           28.37          15.42          -49.8        33.34
    14     {'Green'       }       118           209           130           54.38         -39.72          32.27       22.461
    15     {'Red'         }       234           116           114           42.43          51.05          28.62        21.87
    16     {'Yellow'      }       241           227           105            81.8           2.67          80.41       23.495
      ⋮
Read and display an image of a custom test chart with color patch ROIs. This example simulates a custom test chart image by cropping an Imatest eSFR test chart.
I = imread("RGBColorPatches.jpg");
imshow(I)
Draw ROIs for the red, green, and blue color patches.
numROIs = 3;
roiPos = zeros(numROIs,4);
for cnt = 1:numROIs
    hrect = drawrectangle;
    roiPos(cnt,:) = hrect.Position;
end

Load the reference L*a*b* values of the color patches, which are saved in a file called RGBColorPatches_refLab.mat. The white point of the reference values is the CIE standard illuminant D50.
load("RGBColorPatches_refLab.mat");Calculate the color reproduction values for these selected edges, specifying the white point.
colorValues = measureColor(I,roiPos,refLab,ReferenceLABWhitePoint="d50");On a color patch diagram, display the measured and reference colors and the color error.
displayColorPatch(colorValues)

Input Arguments
Name-Value Arguments
Output Arguments
More About
References
[1] Imatest. "Esfr". https://www.imatest.com/mathworks/esfr/.
[2] Calibrite. "ColorChecker Classic". https://calibrite.com/us/product/colorchecker-classic/.