orthosliceViewer
Browse orthogonal slices in grayscale or RGB volume
Description
An orthosliceViewer object displays volumetric image data by
presenting three orthogonal views of the volume along the x,
y, and z dimensions.
Use orthosliceViewer to look at individual slices in a volume. The
orthosliceViewer opens, displaying the center slice in each dimension. Each
view of the image stack includes a crosshair that you can use to view the different slices of
the image stack. The crosshairs are linked so that if you move one, the crosshairs in the
related views also move.
The orthosliceViewer object supports properties, object functions, and
events that you can use to customize its appearance and functioning. The
orthosliceViewer object can send notifications when certain events occur,
such as the crosshair moving. For more information, see Events.
Note
By default, clicking and dragging the mouse in the slices displayed interactively changes their brightness and contrast, a technique called window/level. Dragging the mouse horizontally from left to right changes the contrast. Dragging the mouse vertically up and down changes the brightness. Holding down the Ctrl key when clicking and dragging the mouse accelerates changes. Holding down the Shift key while clicking and dragging the mouse slows the rate of change. Press these keys before clicking and dragging. To control this behavior, use the DisplayRangeInteraction property.
Creation
Description
orthosliceViewer(
sets properties of the V,PropertyName=Value)orthosliceViewer using one or more name-value pair
arguments.
Example: orthosliceViewer(V,Colormap=cmap) creates an
orthosliceViewer object and specifies the colormap used to display the
volume.
s = orthosliceViewer(___)orthosliceViewer object, s, with
properties that can be used to control the visualization of the images. Use input
arguments from any of the previous syntaxes.
Input Arguments
Properties
General Properties
Colormap of the image stack, specified as an m-by-3 numeric
array with values in the range [0, 1]. The Colormap property has
no effect when V is an RGB image stack.
Display range of grayscale volume, specified as a 2-element vector of the form
[low high]. The value low (and any value less
than low) displays as black. The value high (and
any value greater than high) displays as white. Values in between
are displayed as intermediate shades of gray, using the default number of gray levels.
If you specify an empty matrix ([]),
orthosliceViewer uses the default value.
DisplayRange has no effect when you specify an RGB volume.
Interactive control of the display range, specified as one of the following values. This property has no affect when you specify an RGB image stack. For more information about using this capability, see Events.
| Value | Description |
|---|---|
"on" (default for grayscale intensity volumes) | You can control the display range of a grayscale image stack by left-clicking the mouse and dragging it on the axes. |
"off" (default for logical and RGB volumes) | No display range interactivity. |
Parent of the orthosliceViewer object, specified as a handle to
a uipanel or as a figure created with either the
figure or uifigure function. If you do not
specify a parent, the parent of the orthosliceViewer object is
gcf.
Scale factors used to rescale the volume, specified as a 1-by-3 positive numeric vector. The values in the array correspond to the scale factor applied in the x, y, and z directions.
The orthosliceViewer scales the orthogonal slice views by
adjusting the display axes limits. The viewer scales the axes limits relative to each
other, such that specifying a ScaleFactors value of [1 1
2] generates the same display as a value of [2 2 4].
The xyz-coordinates in the lower-right corner of the viewer
reflect the crosshairs position within the scaled display axes, rather than slice
numbers of the input volume V.
Indices of image slices to be displayed, specified as a 1-by-3 nonnegative numeric
array. orthosliceViewer displays the corresponding slices at the
[x,y,z] indices in the YZ,
XZ, and XY views.
Crosshair Properties
Crosshair color, specified as an RGB triplet, a hexadecimal color code, a color name, or a short color name.
For a custom color, specify an RGB triplet or a hexadecimal color code.
An RGB triplet is a three-element row vector whose elements specify the intensities of the red, green, and blue components of the color. The intensities must be in the range
[0,1], for example,[0.4 0.6 0.7].A hexadecimal color code is a string scalar or character vector that starts with a hash symbol (
#) followed by three or six hexadecimal digits, which can range from0toF. The values are not case sensitive. Therefore, the color codes"#FF8800","#ff8800","#F80", and"#f80"are equivalent.
Alternatively, you can specify some common colors by name. This table lists the named color options, the equivalent RGB triplets, and the hexadecimal color codes.
| Color Name | Short Name | RGB Triplet | Hexadecimal Color Code | Appearance |
|---|---|---|---|---|
"red" | "r" | [1 0 0] | "#FF0000" |
|
"green" | "g" | [0 1 0] | "#00FF00" |
|
"blue" | "b" | [0 0 1] | "#0000FF" |
|
"cyan"
| "c" | [0 1 1] | "#00FFFF" |
|
"magenta" | "m" | [1 0 1] | "#FF00FF" |
|
"yellow" | "y" | [1 1 0] | "#FFFF00" |
|
"black" | "k" | [0 0 0] | "#000000" |
|
"white" | "w" | [1 1 1] | "#FFFFFF" |
|
This table lists the default color palettes for plots in the light and dark themes.
| Palette | Palette Colors |
|---|---|
Before R2025a: Most plots use these colors by default. |
|
|
|
You can get the RGB triplets and hexadecimal color codes for these palettes using the
orderedcolors
and rgb2hex
functions. For example, get the RGB triplets for the "gem" palette and
convert them to hexadecimal color
codes.
RGB = orderedcolors("gem");
H = rgb2hex(RGB);
Before R2023b: Get the RGB triplets using RGB =
get(groot,"FactoryAxesColorOrder").
Example: CrosshairColor="r"
Example: CrosshairColor="green"
Example: CrosshairColor=[0 0.4470 0.7410]
Example: CrosshairColor="#00FFFF"
State of the linked crosshair objects, specified as "on",
"inactive", or "off".
| Value | Description |
|---|---|
"on" | Crosshair is visible and can be interacted with. |
"inactive" | Crosshair is visible but cannot be interacted with |
"off" | Crosshair is not visible. |
Width of the crosshair line, specified as a positive numeric scalar, measured in points. The default value is the number of points per screen pixel.
Color of the crosshair stripe, specified as an RGB triplet, a hexadecimal color
code, a color name, a short color name, or "none". If you specify
"none", then the crosshair is a solid color specified by the
CrosshairColor property. Otherwise, the crosshair is striped,
with colors alternating between the color specified by this property and the color
specified by the CrosshairColor property.
For a custom color, specify an RGB triplet or a hexadecimal color code.
An RGB triplet is a three-element row vector whose elements specify the intensities of the red, green, and blue components of the color. The intensities must be in the range
[0,1], for example,[0.4 0.6 0.7].A hexadecimal color code is a string scalar or character vector that starts with a hash symbol (
#) followed by three or six hexadecimal digits, which can range from0toF. The values are not case sensitive. Therefore, the color codes"#FF8800","#ff8800","#F80", and"#f80"are equivalent.
Alternatively, you can specify some common colors by name. This table lists the named color options, the equivalent RGB triplets, and the hexadecimal color codes.
| Color Name | Short Name | RGB Triplet | Hexadecimal Color Code | Appearance |
|---|---|---|---|---|
"red" | "r" | [1 0 0] | "#FF0000" |
|
"green" | "g" | [0 1 0] | "#00FF00" |
|
"blue" | "b" | [0 0 1] | "#0000FF" |
|
"cyan"
| "c" | [0 1 1] | "#00FFFF" |
|
"magenta" | "m" | [1 0 1] | "#FF00FF" |
|
"yellow" | "y" | [1 1 0] | "#FFFF00" |
|
"black" | "k" | [0 0 0] | "#000000" |
|
"white" | "w" | [1 1 1] | "#FFFFFF" |
|
This table lists the default color palettes for plots in the light and dark themes.
| Palette | Palette Colors |
|---|---|
Before R2025a: Most plots use these colors by default. |
|
|
|
You can get the RGB triplets and hexadecimal color codes for these palettes using the
orderedcolors
and rgb2hex
functions. For example, get the RGB triplets for the "gem" palette and
convert them to hexadecimal color
codes.
RGB = orderedcolors("gem");
H = rgb2hex(RGB);
Before R2023b: Get the RGB triplets using RGB =
get(groot,"FactoryAxesColorOrder").
Example: CrosshairStripeColor="r"
Example: CrosshairStripeColor="green"
Example: CrosshairStripeColor=[0 0.4470 0.7410]
Example: CrosshairStripeColor="#00FFFF"
Object Functions
addlistener | Create event listener bound to event source |
getAxesHandles | Get handles to axes in Orthoslice Viewer |
Examples
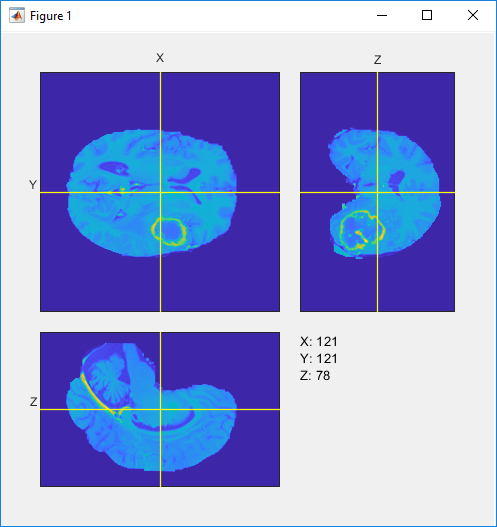
Load an image stack into the workspace.
load(fullfile(toolboxdir('images'),'imdata','BrainMRILabeled','images','vol_001.mat'));
Create a custom Colormap.
cmap = parula(256);
View the MRI data in the Orthoslice Viewer.
s = orthosliceViewer(vol,'Colormap',cmap)s =
orthosliceViewer with properties:
SliceNumbers: [121 121 78]
CrosshairColor: [1 1 0]
CrosshairLineWidth: 1
CrosshairStripeColor: 'none'
CrosshairEnable: 'on'
Parent: [1×1 Panel]
Colormap: [256×3 double]
DisplayRange: [0 2239]
ScaleFactors: [1 1 1]
DisplayRangeInteraction: 'on'

Load MRI data and view it in the Orthoslice Viewer.
load(fullfile(toolboxdir("images"),"imdata","BrainMRILabeled","images","vol_001.mat"));
s = orthosliceViewer(vol);
Get the handle of the axes that contains the slice.
[hXYAxes,hYZAxes,hXZAxes] = getAxesHandles(s);
Turn off the crosshair for better visibility.
set(s,CrosshairEnable="off");Specify the name of the GIF file.
filename = "animatedYZSlice.gif";Create an array of slice numbers in the required direction. Consider the YZ direction.
sliceNums = 1:240;
Loop through and create an image at the specified slice position.
for idx = sliceNums
    % Update X slice number to get YZ Slice
    s.SliceNumbers(1) = idx;

    % Use getframe to capture the image
    I = getframe(hYZAxes);
    [indI,cm] = rgb2ind(I.cdata,256);

    % Write frame to the GIF File
    if idx == 1
        imwrite(indI,cm,filename,"gif",Loopcount=inf,DelayTime=0.05);
    else
        imwrite(indI,cm,filename,"gif",WriteMode="append",DelayTime=0.05);
    end
end
View the animated GIF.

Load a stack of images.
load(fullfile(toolboxdir('images'),'imdata','BrainMRILabeled','images','vol_001.mat'));
Create a custom colormap for viewing slices.
cmap = parula(256);
View the image stack in the Orthoslice Viewer.
os = orthosliceViewer(vol,'Colormap',cmap);
Set up listeners for the two Orthoslice Viewer crosshair moving events. When you move the crosshair, the Orthoslice Viewer sends notifications of these events and executes the callback function you specify.
addlistener(os,'CrosshairMoving',@allevents);
addlistener(os,'CrosshairMoved',@allevents);
The allevents callback function displays the name of each event with the previous position and the current position of the crosshair.
function allevents(src,evt)
evname = evt.EventName;
    switch(evname)
        case{'CrosshairMoved'}
            disp(['Crosshair moved previous position: ' mat2str(evt.PreviousPosition)]);
            disp(['Crosshair moved current position: ' mat2str(evt.CurrentPosition)]);
        case{'CrosshairMoving'}
            disp(['Crosshair moving previous position: ' mat2str(evt.PreviousPosition)]);
            disp(['Crosshair moving current position: ' mat2str(evt.CurrentPosition)]);
    end
 end