viewer3d
Description
creates a
viewer = viewer3dViewer object in a new figure window that is configured for 3-D image
display. Use viewer to query and modify properties of the
Viewer object after you create the object. For a list of properties, see
Viewer Properties.
creates a viewer = viewer3d(___,Name=Value)Viewer object and sets properties of the object using one or more
name-value arguments, in addition to any of the input arguments from previous
syntaxes.
For example,
viewer3d(BackgroundColor="green",BackgroundGradient=false) creates a
Viewer object in a new figure window with a green background and no
background gradient.
Examples
Create a 3-D viewer window, and specify the appearance of the background and lighting using name-value arguments.
viewer = viewer3d(BackgroundColor="white", ... GradientColor=[0.5 0.5 0.5],Lighting="on")
viewer =
Viewer with properties:
Parent: [1×1 Figure]
Position: [1 1 560 420]
Children: [0×0 GraphicsPlaceholder]
BackgroundColor: [1 1 1]
BackgroundGradient: on
GradientColor: [0.5000 0.5000 0.5000]
OrientationAxes: on
ClippingPlanes: [0×4 single]
Lighting: on
LightPosition: [0 0 0]
CameraPosition: [1 1 1]
CameraTarget: [0 0 0]
CameraUpVector: [0 0 1]
CameraZoom: 1
Show all properties
Display a volumetric image in the scene.
load(fullfile(toolboxdir("images"),"imdata", ... "BrainMRILabeled","images","vol_001.mat")); mriVol = volshow(vol,Parent=viewer);
Change the camera perspective of the scene by setting scene properties using dot notation.
viewer.CameraPosition = [120 120 200]; viewer.CameraTarget = [120 120 -10]; viewer.CameraUpVector = [0 1 0]; viewer.CameraZoom = 1.5;
Add a title and scale bar within the viewer window.
viewer.Title = "Brain MRI"; viewer.ScaleBar = "on";

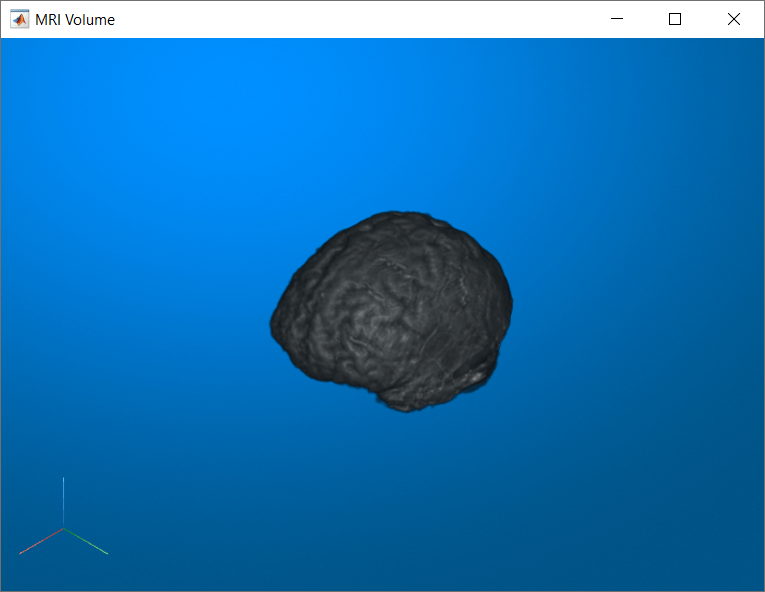
Create a grid layout manager whose parent is a figure created using the uifigure function.
fig = uifigure(Name="MRI Volume");
g = uigridlayout(fig,[1 1],Padding=[0 0 0 0]);Create a scene with the default appearance in the grid layout manager.
viewer = viewer3d(g);

Display a volumetric image in the scene.
load(fullfile(toolboxdir("images"),"imdata", ... "BrainMRILabeled","images","vol_001.mat")); mriVol = volshow(vol,Parent=viewer);

Input Arguments
Parent of the 3-D viewer, specified as a Figure object created
using the uifigure function, or a
Panel, GridLayout, or Tab object
whose parent is a figure created using the uifigure function. You
can use the uipanel, uigridlayout, and uitab functions to create the corresponding objects.
Tip
A GridLayout object is the recommended parent when you want to
build an app in App Designer, or when you want to add and position other UI components
in a figure with the 3-D viewer.
When the parent is a GridLayout object, you can adjust the layout
of the 3-D viewer using the Layout property.
Example: parent = uifigure; viewer = viewer3d(parent); creates a
parent figure using the uifigure function
Example: f = uifigure; parent = uipanel(f); viewer =
viewer3d(parent); creates a parent Panel object whose
parent is a figure created using the uifigure
function.
Name-Value Arguments
Specify optional pairs of arguments as
Name1=Value1,...,NameN=ValueN, where Name is
the argument name and Value is the corresponding value.
Name-value arguments must appear after other arguments, but the order of the
pairs does not matter.
Example: viewer3d(BackgroundColor="green",BackgroundGradient=false)
creates a Viewer object for 3-D display in a new figure with a green
background and no background gradient.
Note
The properties listed here are only a subset. For a full list, see Viewer Properties.
Color of the background, specified as an RGB triplet, a hexadecimal color code, a
color name, or a short color name. When you select light mode in MATLAB®, the default color is [0 0.329 0.529]. When you
select dark mode in MATLAB, the default color is [0.1 0.1 0.1].
For a custom color, specify an RGB triplet or a hexadecimal color code.
An RGB triplet is a three-element row vector whose elements specify the intensities of the red, green, and blue components of the color. The intensities must be in the range
[0,1], for example,[0.4 0.6 0.7].A hexadecimal color code is a string scalar or character vector that starts with a hash symbol (
#) followed by three or six hexadecimal digits, which can range from0toF. The values are not case sensitive. Therefore, the color codes"#FF8800","#ff8800","#F80", and"#f80"are equivalent.
Alternatively, you can specify some common colors by name. This table lists the named color options, the equivalent RGB triplets, and the hexadecimal color codes.
| Color Name | Short Name | RGB Triplet | Hexadecimal Color Code | Appearance |
|---|---|---|---|---|
"red" | "r" | [1 0 0] | "#FF0000" |
|
"green" | "g" | [0 1 0] | "#00FF00" |
|
"blue" | "b" | [0 0 1] | "#0000FF" |
|
"cyan"
| "c" | [0 1 1] | "#00FFFF" |
|
"magenta" | "m" | [1 0 1] | "#FF00FF" |
|
"yellow" | "y" | [1 1 0] | "#FFFF00" |
|
"black" | "k" | [0 0 0] | "#000000" |
|
"white" | "w" | [1 1 1] | "#FFFFFF" |
|
"none" | Not applicable | Not applicable | Not applicable | No color |
This table lists the default color palettes for plots in the light and dark themes.
| Palette | Palette Colors |
|---|---|
Before R2025a: Most plots use these colors by default. |
|
|
|
You can get the RGB triplets and hexadecimal color codes for these palettes using the orderedcolors and rgb2hex functions. For example, get the RGB triplets for the "gem" palette and convert them to hexadecimal color codes.
RGB = orderedcolors("gem");
H = rgb2hex(RGB);Before R2023b: Get the RGB triplets using RGB =
get(groot,"FactoryAxesColorOrder").
Before R2024a: Get the hexadecimal color codes using H =
compose("#%02X%02X%02X",round(RGB*255)).
Example: BackgroundColor="r"
Example: BackgroundColor="green"
Example: BackgroundColor=[0 0.4470 0.7410]
Example: BackgroundColor="#FF8800"
Background gradient is present, specified as "on" or "off", or as a numeric or logical
1 (true) or 0
(false). A value of "on" is equivalent to
true, and "off" is equivalent to
false. The value is stored as an on/off logical value of type OnOffSwitchState. This property specifies whether the background is shaded with a gradient
from GradientColor to BackgroundColor. When
this property is false, the GradientColor
property has no effect.
Color of the background gradient shading, specified as an RGB triplet, a
hexadecimal color code, a color name, or a short color name. When
BackgroundGradient is true, the background
is shaded as a gradient from GradientColor to
BackgroundColor. When you select light mode in MATLAB, the default color is [0.0 0.561 1.0]. When you
select dark mode in MATLAB, the default color is [0.3 0.3 0.3].
For a custom color, specify an RGB triplet or a hexadecimal color code.
An RGB triplet is a three-element row vector whose elements specify the intensities of the red, green, and blue components of the color. The intensities must be in the range
[0,1], for example,[0.4 0.6 0.7].A hexadecimal color code is a string scalar or character vector that starts with a hash symbol (
#) followed by three or six hexadecimal digits, which can range from0toF. The values are not case sensitive. Therefore, the color codes"#FF8800","#ff8800","#F80", and"#f80"are equivalent.
Alternatively, you can specify some common colors by name. This table lists the named color options, the equivalent RGB triplets, and the hexadecimal color codes.
| Color Name | Short Name | RGB Triplet | Hexadecimal Color Code | Appearance |
|---|---|---|---|---|
"red" | "r" | [1 0 0] | "#FF0000" |
|
"green" | "g" | [0 1 0] | "#00FF00" |
|
"blue" | "b" | [0 0 1] | "#0000FF" |
|
"cyan"
| "c" | [0 1 1] | "#00FFFF" |
|
"magenta" | "m" | [1 0 1] | "#FF00FF" |
|
"yellow" | "y" | [1 1 0] | "#FFFF00" |
|
"black" | "k" | [0 0 0] | "#000000" |
|
"white" | "w" | [1 1 1] | "#FFFFFF" |
|
"none" | Not applicable | Not applicable | Not applicable | No color |
This table lists the default color palettes for plots in the light and dark themes.
| Palette | Palette Colors |
|---|---|
Before R2025a: Most plots use these colors by default. |
|
|
|
You can get the RGB triplets and hexadecimal color codes for these palettes using the orderedcolors and rgb2hex functions. For example, get the RGB triplets for the "gem" palette and convert them to hexadecimal color codes.
RGB = orderedcolors("gem");
H = rgb2hex(RGB);Before R2023b: Get the RGB triplets using RGB =
get(groot,"FactoryAxesColorOrder").
Before R2024a: Get the hexadecimal color codes using H =
compose("#%02X%02X%02X",round(RGB*255)).
Example: GradientColor="r"
Example: GradientColor="green"
Example: GradientColor=[0 0.4470 0.7410]
Example: GradientColor="#FF8800"
Since R2025a
Title for viewer, specified as a string scalar or character vector. The title appears in the top center of the viewer window.
Strength of ambient light in the scene, specified as a numeric scalar in the range [0, 1]. This property specifies the amount of ambient light in the scene.
Strength of diffuse light, specified as a numeric scalar in the range [0, 1]. This
property specifies the amount of diffuse light provided by the light sources in the
Lights property of Viewer.
Specify the DiffuseLight name-value argument if you have one
light source in a scene, or to update all light sources in a multilight scene to the
same value. To adjust an individual light in a multilight scene, set the
Intensity property of the corresponding Light
object in the Lights property.
Since R2023b
Apply edge-preserving denoising, specified as "on" or "off", or as a numeric or logical
1 (true) or 0
(false). A value of "on" is equivalent to
true, and "off" is equivalent to
false. The value is stored as an on/off logical value of type OnOffSwitchState.
When this value is "on", the viewer applies edge-preserving
denoising to all objects in the viewer. By default, the value is
"off". If the viewer contains a Volume object
displayed using cinematic rendering, meaning the RenderingStyle property value is
"CinematicRendering", the Denoising value
automatically changes to "on".
Output Arguments
3-D viewer, returned as a Viewer object configured for 3-D image
display. When you create a Viewer by using the
viewer3d function, the function sets certain properties to
support 3-D visualization. For details about which properties have different defaults
when created by viewer3d instead of viewer2d,
see Viewer Properties.
More About
To receive notification from the
Viewer object when certain events happen, set up
listeners for these events. You can specify a callback function
that executes when one of these events occurs. When the Viewer object
notifies your application through the listener, it returns data specific to the event. Look
at the event class for the specific event to see what is returned.
| Event Name | Trigger | Event Data | Event Attributes |
|---|---|---|---|
AnnotationAdded | A point or line annotation has been interactively added to the viewer. This event does not execute if an annotation is programmatically added. | images.ui.graphics.events.AnnotationAddedEventData |
|
AnnotationEdited | The label of a point or line annotation has been interactively edited. This event does not execute if an annotation label is programmatically edited. | images.ui.graphics.events.AnnotationEditedEventData |
|
AnnotationMoved | A point or line annotation has been interactively moved within the viewer. This event does not execute if an annotation is programmatically moved. | images.ui.graphics.events.AnnotationMovedEventData |
|
AnnotationRemoved | A point or line annotation has been interactively removed from the viewer. This event does not execute if an annotation is programmatically removed. | images.ui.graphics.events.AnnotationRemovedEventData |
|
CameraMoving | The camera is being interactively moved. This event does not execute if the camera is programmatically moved. | images.ui.graphics.events.CameraMovedEventData |
|
CameraMoved | The camera stops being interactively moved. This event does not execute if the camera is programmatically moved. | images.ui.graphics.events.CameraMovedEventData |
|
ClippingPlanesChanging | A global clipping plane is being interactively moved. This event does not execute if the clipping plane is programmatically moved. | images.ui.graphics.events.ClippingPlanesChangedEventData |
|
ClippingPlanesChanged | A global clipping plane stops being interactively moved. This event does not execute if the clipping plane is programmatically moved. | images.ui.graphics.events.ClippingPlanesChangedEventData |
|
CropRegionChanged | The crop region stops being interactively changed. This event does not execute if the crop region is programmatically changed. | images.ui.graphics.events.CropRegionChangedEventData |
|
ViewerRefreshed | The viewer has been refreshed. You can refresh a viewer either by reparenting the viewer or by modifying the ancestor hierarchy of the parent object. When you refresh a viewer, the viewer is cleared and no longer contains any child objects. To recreate the scene, you can listen to this event and reconstruct any objects that were parented to the viewer. | event.EventData |
|
Tips
To clear all objects from the scene and delete all data containers previously added to the 3-D viewer
viewer, use the command:clear(viewer)
To delete all objects in the scene and the 3-D viewer
viewer, use the command:delete(viewer)
Version History
Introduced in R2022bThe 3-D viewer offers new options when displaying volumes, blocked volumes, and surfaces. The viewer now supports:
Adding a title. Add a title by specifying the new
Titleproperty.Adding a zoom scale bar by specifying the new
ScaleBarStyleproperty as"zoom".Displaying information about the voxel or surface point beneath the pointer. Toggle the visibility of the voxel information display from the viewer context menu or by using the new
DisplayInfoproperty. You can interactively copy voxel coordinates to the clipboard, or export voxel information to the workspace from the viewer context menu.
The viewer toolbar is now always visible by default, regardless of whether the pointer
is inside or outside the viewer window. To preserve the behavior of previous releases,
specify the Toolbar property as "hover", which hides
the toolbar when you move the pointer outside the viewer window.
The function now returns a
Viewerobject, because theViewer3Dobject has been renamed to reflect support for displaying 2-D images. TheViewerobject has the same properties and default behavior asViewer3D. Existing instances of theViewer3Dobject continue to work as expected, and there are no plans to remove support for references toViewer3D.The default background color for a viewer created using
viewer3din light mode has changed from[0 0.329 0.529]to[0 0.251 0.451]. The default background gradient color in light mode has changed from[0.0 0.561 1.0]to[0.0667 0.4431 0.7451].
Crop the objects in a viewer to a spherical or cylindrical region, in addition to the rectangular crop region supported in prior releases. To add a spherical or cylindrical crop region, specify the
CropRegionproperty as a 4-element or 5-element row vector, respectively. Modify the crop region interactively in the viewer window.Specify whether to view the region inside or outside a crop region by specifying the new
CropModeproperty.
Label 3-D points and lines in a scene using annotations. Add annotations interactively
from the Viewer3D toolbar. By default, the viewer labels point annotations
with their 3-D coordinates, and line annotations with their length.
Programmatically query or update annotations using the new
Annotations property of Viewer3D. The new Point and Line objects and
their properties define the position, color, and label of point and line annotations,
respectively.
The Viewer3D object
has new properties and tools to control the lighting and remove objects in a scene. To set
any of these property values at object creation, specify them to the
viewer3d function as name-value arguments.
Control the strength of ambient and diffuse light within a viewer using the new
AmbientLightandDiffuseLightproperties, respectively.Apply denoising to the objects in a viewer using the new
Denoisingproperty. Specify the amount of smoothing and standard deviation of the Gaussian smoothing kernel using the newDenoisingDegreeOfSmoothingandDenoisingSigmaproperties, respectively.Use a crop box to crop the objects in a viewer to a rectangular subregion. To interactively add a crop box, click the crop box button
in the Viewer3Daxes toolbar. To crop the display, drag the faces of the crop box. To move the crop box, hold Ctrl while you drag. You can programmatically define the crop region by setting the newCropRegionproperty.Use the 3-D scissors tool to remove regions from of a viewer. To enable the tool, click the scissors button
in the Viewer3Daxes toolbar. Draw a 2-D polygon that contains the object you want to remove. The tool removes everything from the 3-D cut region, which it defines by extruding the polygon along the axis normal to the drawing plane.
MATLAB Command
You clicked a link that corresponds to this MATLAB command:
Run the command by entering it in the MATLAB Command Window. Web browsers do not support MATLAB commands.
Sélectionner un site web
Choisissez un site web pour accéder au contenu traduit dans votre langue (lorsqu'il est disponible) et voir les événements et les offres locales. D’après votre position, nous vous recommandons de sélectionner la région suivante : .
Vous pouvez également sélectionner un site web dans la liste suivante :
Comment optimiser les performances du site
Pour optimiser les performances du site, sélectionnez la région Chine (en chinois ou en anglais). Les sites de MathWorks pour les autres pays ne sont pas optimisés pour les visites provenant de votre région.
Amériques
- América Latina (Español)
- Canada (English)
- United States (English)
Europe
- Belgium (English)
- Denmark (English)
- Deutschland (Deutsch)
- España (Español)
- Finland (English)
- France (Français)
- Ireland (English)
- Italia (Italiano)
- Luxembourg (English)
- Netherlands (English)
- Norway (English)
- Österreich (Deutsch)
- Portugal (English)
- Sweden (English)
- Switzerland
- United Kingdom (English)