clrmenu
(Removed) Add colormap menu to figure window
The clrmenu function has been removed. Use the Colormap Editor instead.
Activation
Command Line |
|---|
|
Description
clrmenu adds a colormap menu to the current figure.
clrmenu(h) adds a colormap menu to the figure specified by the
handle h.
Controls
The following choices are included on the colormap menu:
Parula, Gray, Hsv, Hot, Pink, Cool, Bone, Jet, Copper, Spring, Summer, Autumn, Winter, Flag, and Prism generate colormaps.
Rand is a random colormap.
Brighten increases the brightness.
Darken decreases the brightness.
Flipud inverts the order of the colormap entries.
Fliplr interchanges the red and blue components.
Permute permutes the colormap: red > blue, blue > green, green > red.
Define allows a workspace variable to be specified for the colormap.
Remember stores the current colormap.
Restore reverts to the stored colormap (initially,
the stored colormap is the colormap in use when clrmenu is
invoked).
Refresh redraws the current figure window.
Digital Elevation activates the DEM Colormap Input dialog box. Use it to specify a colormap for a digital elevation map, and then apply the colormap to the current figure. The number of land and sea colors in the colormap is appropriate for the maximum elevations and depths of the data grid. The dialog box is shown and described below:
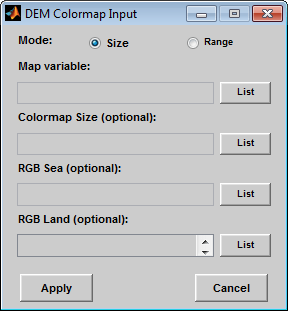
The Mode selection buttons are used to specify whether the length of the colormap is specified or whether the altitude range increment assigned to each color is specified.
The Map variable edit box is used to specify the data grid containing the elevation data.
The Colormap Size edit box is used in Size mode. This entry defines the length of the colormap. If omitted, a default length of 64 is used. This entry must be a scalar value.
The Altitude Range edit box is used in Range mode. This entry defines the altitude range increment assigned to each color. If omitted, a default increment of 100 is used. This entry must be a scalar value.
The RGB Sea edit box is used to define colors for
data with negative values. The actual sea colors of the generated colormap are
interpolated from this matrix. This entry can be a matrix of any length
(n-by-3) The colormap matrix of the current figure can be used by
entering 'window' in this box. The demcmap
function provides default sea colors, which are used if this entry is left blank.
The RGB Land edit box is used to define colors for
data with positive values. The actual land colors of the generated colormap are
interpolated from this matrix. This entry can be a matrix of any length
(n-by-3). The colormap matrix of the current figure can be used
by entering 'window' in this box. The demcmap
function provides default sea colors, which are used if this entry is left blank.
Pressing the Apply button accepts the input data, creates the colormap, and assigns it to the current figure.
Pressing the Cancel button disregards any input data and closes the DEM Colormap Input dialog box.