colormap
Afficher et définir la palette de couleurs actuelle
Syntaxe
Description
Définir la palette de couleurs
colormap définit l'usage d'une palette prédéfinie et spécifiée comme palette pour la figure actuelle. Par exemple, mapcolormap hot définit l'usage de la palette de couleurs hot.
Si vous définissez la palette de couleurs pour la figure, alors les axes et les graphiques sur cette figure l’utiliseront également. La nouvelle palette de couleurs est de la même longueur (nombre de couleurs) que l’actuelle. Lorsque vous utilisez cette syntaxe, vous ne pouvez pas spécifier de longueur personnalisée pour la palette de couleurs. Pour plus d’informations sur les palettes de couleurs, consultez la section En savoir plus.
cmap = colormap(___)cmap en tant qu’argument de sortie avec n’importe laquelle des syntaxes précédentes utilisant les parenthèses.
Obtenir la palette de couleurs actuelle
cmap = colormap
Exemples
Créez un graphique de surface, puis définissez la palette de couleurs sur winter.
surf(peaks)
colormap winter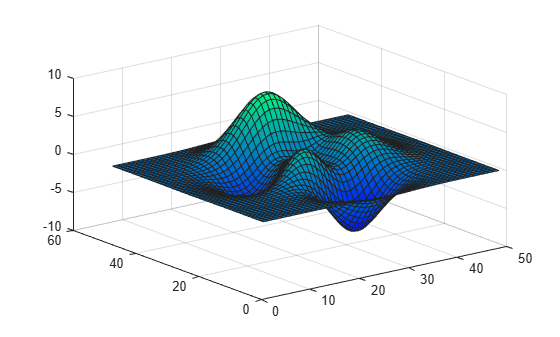
Modifiez d’abord la palette de couleurs de la figure actuelle en la définissant sur summer.
surf(peaks)
colormap summer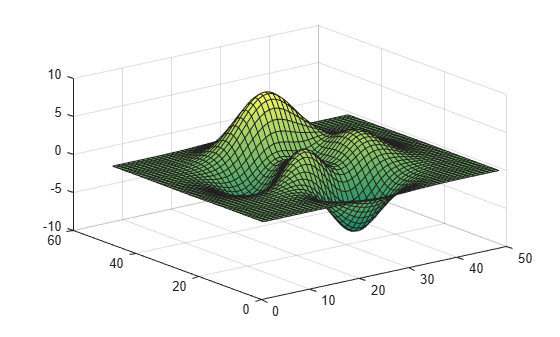
Restaurez maintenant les valeurs par défaut de votre système pour cette palette de couleurs. Si vous n’avez pas spécifié de valeur par défaut différente, alors la palette de couleurs par défaut est parula.
colormap default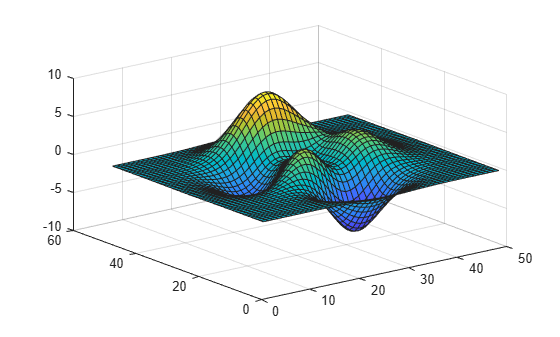
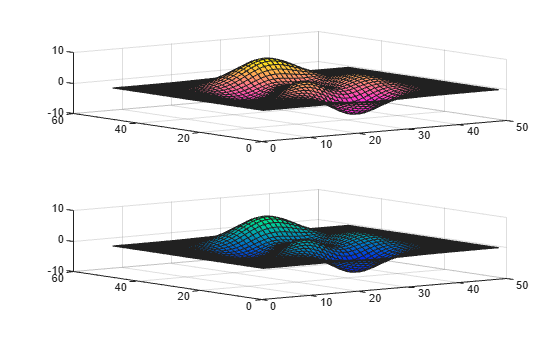
Vous pouvez afficher une mosaïque de tracés avec les fonctions tiledlayout et nexttile. Utilisez la fonction tiledlayout pour créer une disposition de graphique en mosaïque de 2 x 1. Utilisez la fonction nexttile pour créer les objets axes, ax1 et ax2. Spécifiez une palette de couleurs différentes pour chaque axe en faisant passer les objets des axes dans la fonction colormap. Dans les axes supérieurs, créez un graphique de surface avec la palette de couleurs spring. Dans les axes inférieurs, créez un graphique de surface avec la palette de couleurs winter.
tiledlayout(2,1)
ax1 = nexttile;
surf(peaks)
colormap(ax1,spring)

ax2 = nexttile;
surf(peaks)
colormap(ax2,winter)
Spécifiez le nombre de couleurs utilisées dans une palette de couleur en plaçant un chiffre entier en tant qu’argument d'entrée dans la palette de couleurs prédéfinie. Utilisez cinq couleurs de la palette de couleurs parula.
mesh(peaks)
colormap(parula(5))
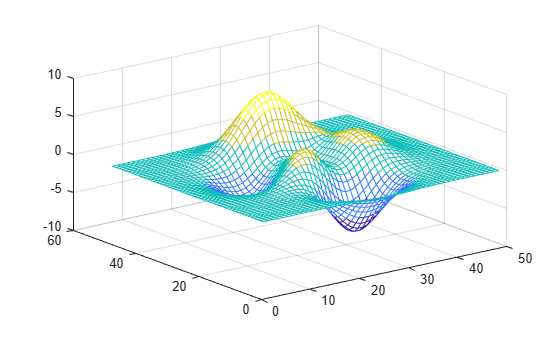
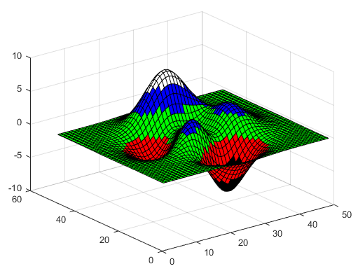
Créez une palette de couleurs personnalisée en définissant une matrice à trois colonnes aux valeurs comprises entre 0,0 et 1,0. Chaque ligne définit un triplet RGB à trois éléments. La première colonne spécifie les intensités du rouge. La deuxième colonne spécifie les intensités du vert. La troisième colonne spécifie les intensités du bleu.
Utilisez une palette de couleurs de valeurs bleues en définissant les deux premières colonnes sur zéro.
map = [0 0 0.3
    0 0 0.4
    0 0 0.5
    0 0 0.6
    0 0 0.8
    0 0 1.0];

surf(peaks)
colormap(map)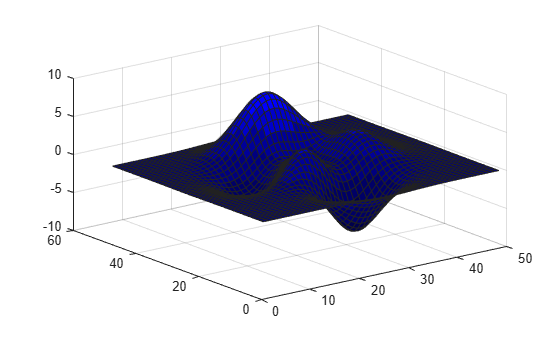
Créez un graphique de surface pour la fonction peaks, puis spécifiez une palette de couleurs.
mesh(peaks)
colormap(autumn(5))

Renvoyez la matrice à trois colonnes des valeurs qui définissent les couleurs utilisées dans le graphique. Chaque ligne est une valeur de couleur de triplet RGB qui spécifie une couleur de la palette de couleurs.
cmap = colormap
cmap = 5×3

    1.0000         0         0
    1.0000    0.2500         0
    1.0000    0.5000         0
    1.0000    0.7500         0
    1.0000    1.0000         0
Renvoyez les valeurs de la palette de couleurs pour un axe spécifique en faisant passer les objets des axes dans la fonction colormap.
Créez une mosaïque de deux tracés avec les fonctions tiledlayout et nexttile. Utilisez la fonction tiledlayout pour créer une disposition de graphique en mosaïque de 2 x 1. Utilisez la fonction nexttile pour créer les objets axes, ax1 et ax2. Affichez ensuite deux courbes de niveaux coloriées avec différentes palettes de couleurs.
tiledlayout(2,1)
ax1 = nexttile;
contourf(peaks)
colormap(ax1,hot(8))

ax2 = nexttile;
contourf(peaks)
colormap(ax2,pink)
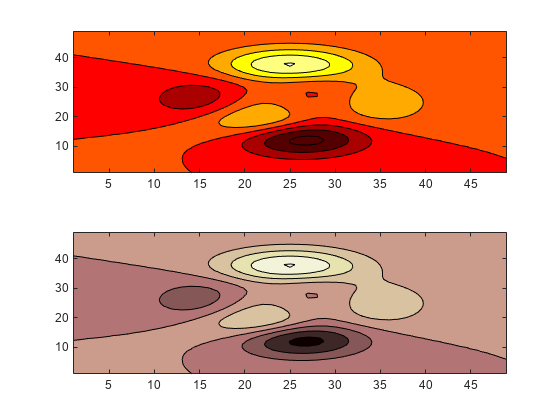
Renvoyez les valeurs de la palette de couleurs utilisées dans la courbe supérieure en passant ax1 dans la fonction colormap. Chaque ligne est une valeur de couleur de triplet RGB qui spécifie une couleur de la palette de couleurs.
cmap = colormap(ax1)
cmap = 8×3

    0.3333         0         0
    0.6667         0         0
    1.0000         0         0
    1.0000    0.3333         0
    1.0000    0.6667         0
    1.0000    1.0000         0
    1.0000    1.0000    0.5000
    1.0000    1.0000    1.0000
Chargez le jeu de données spine qui renvoie l’image X et sa palette de couleurs map associée. Affichez X à l’aide de la fonction image puis définissez la palette de couleurs sur map.
load spine
image(X)
colormap(map)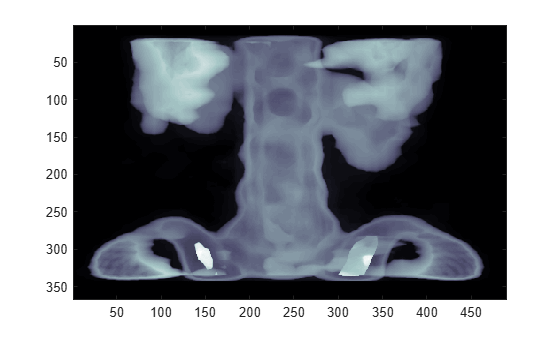
Arguments d'entrée
Palette de couleurs pour le nouveau jeu de couleurs, spécifiée sous forme de nom de palette de couleurs, de matrice à trois colonnes de triplets RGB ou par 'default'. Le nom d’une palette de couleurs spécifie une palette de couleurs dont le nombre de couleurs est identique à celui de l’actuelle. Une matrice à trois colonnes de triplets RGB spécifie une palette de couleurs personnalisée. Vous pouvez créer la matrice vous-même, ou vous pouvez appeler l’une des fonctions de palette de couleurs prédéfinies pour créer la matrice. Par exemple, colormap(parula(10)) définit la palette de couleurs de la figure actuelle sur une sélection de 10 couleurs provenant de la palette de couleurs parula.
Une valeur de 'default' définit la palette de couleurs sur celle par défaut pour l’objet cible.
Nom de la palette de couleurs
Le tableau suivant répertorie les palettes de couleurs prédéfinies.
| Nom de la palette de couleurs | Échelle de couleur |
|---|---|
|
|
|
|
|
|
|
|
|
|
|
|
|
|
|
|
|
|
|
|
|
|
|
|
|
|
|
|
|
|
|
|
|
|
|
|
|
|
|
|
|
|
|
|


Matrice à trois colonnes
Pour créer une palette de couleurs personnalisée, spécifiez map en tant que matrice à trois colonnes de triplets RGB où chaque ligne de la matrice définit une couleur. Un triplet RGB est un vecteur ligne à trois éléments. Ces éléments spécifient l’intensité des composants verts, rouges et bleus de la couleur. Les intensités peuvent avoir des valeurs double ou single sur une plage de [0, 1], ou avoir des valeurs uint8 sur une plage de [0, 255]. Par exemple, cette matrice définit une palette de couleur contenant cinq couleurs.
map = [0.2 0.1 0.5
    0.1 0.5 0.8
    0.2 0.7 0.6
    0.8 0.7 0.3
    0.9 1 0];
Ce tableau répertorie les valeurs de triplets RGB des couleurs communes.
| Couleur | Triplet RGB double ou single | Triplet RGB uint8 |
|---|---|---|
| jaune | [1 1 0] | [255 255 0] |
| magenta | [1 0 1] | [255 0 255] |
| cyan | [0 1 1] | [0 255 255] |
| rouge | [1 0 0] | [255 0 0] |
| vert | [0 1 0] | [0 255 0] |
| bleu | [0 0 1] | [0 0 255] |
| blanc | [1 1 1] | [255 255 255] |
| noir | [0 0 0] | [0 0 0] |
Types de données : char | double | single | uint8
Cible, spécifiée sous forme d’une des valeurs suivantes :
Objet
Figure. La palette de couleurs de la figure affecte les tracés de tous les axes dans cette figure.Objet
Axes, objetPolarAxes, ou objetGeographicAxes. Vous pouvez définir une palette de couleurs unique pour les différents axes au sein d’une figure.Visualisation indépendante dotée d’une propriété
Colormap. Par exemple, vous pouvez modifier ou faire une requête sur la palette de couleurs pour un objetHeatmapChart.
Arguments de sortie
En savoir plus
Une palette de couleurs est une matrice de valeurs qui définit les couleurs des objets graphiques tels qu’une surface, une image et des objets de type patch. MATLAB® trace les objets en mappant les valeurs de données sur les couleurs de la palette de couleurs.
Les palettes de couleurs peuvent être aussi longues que vous le souhaitez, mais doivent avoir une largeur de trois colonnes. Chaque ligne de la matrice définit une couleur à l’aide d’un triplet RGB. Un triplet RGB est un vecteur ligne à trois éléments. Ces éléments spécifient l’intensité des composants verts, rouges et bleus de la couleur. Généralement, les intensités sont des valeurs double ou single comprises dans une gamme de [0, 1]. Une valeur de 0 n’indique aucune couleur ; une valeur de 1 indique une intensité totale. Par exemple, cette commande crée une palette de couleurs à cinq couleurs : noir, rouge, vert, bleu et blanc.
mymap = [0 0 0
    1 0 0
    0 1 0
    0 0 1
    1 1 1];
Pour modifier le jeu de couleurs d’une visualisation, appelez la fonction colormap pour modifier la palette de couleurs des axes ou de la figure. Par exemple, ces commandes créent un graphique de surface qui utilise la palette de couleurs mymap.
surf(peaks)
colormap(mymap)
Conseils
Pour contrôler les limites de la palette de couleurs et la façon dont ses limites sont reliées à la plage de vos données, utilisez la fonction
clim.Avant R2022a : Utilisez
caxis, qui emploie les mêmes syntaxes et arguments queclim.