campos
Set or query position of camera for geographic globe
Syntax
Description
Set Position
Set Mode
campos( sets the camera position to
an automatic mode, enabling the geographic globe to determine the latitude and longitude
of the camera based on the plotted data. The mode defaults to automatic when you create a
geographic globe. If you change the camera position using your mouse, then the mode
switches to automatic. To control the mode for the height of the camera, use the g,"auto")camheight
function instead.
campos( sets the camera position
to a manual mode. When the hold state of the geographic globe is g,"manual")"on",
manual mode specifies that the geographic globe preserve the latitude and longitude of the
camera when the plotted data changes. If you change the camera position using the
campos function, then the mode switches to manual.
Query Position
campos( displays the latitude, longitude,
and ellipsoidal height of the camera as a three-element vector.g)
Examples
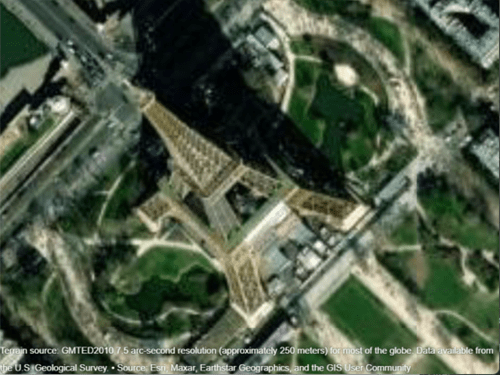
Create a geographic globe. Specify the latitude and longitude of the Eiffel Tower, and specify a height that is 400 meters above the WGS84 reference ellipsoid. Use these values to move the camera.
uif = uifigure;
g = geoglobe(uif);

lat = 48.8584;
lon = 2.2945;
h = 400;
campos(g,lat,lon,h)
Get the position and the heading, pitch, and roll angles of the camera. Use this information to control the view of a different geographic globe or to automate navigation.
Create a geographic globe. Navigate to an area of interest using your mouse or gestures. For this example, navigate to an area around Hawaii.
uif = uifigure;
g = geoglobe(uif);
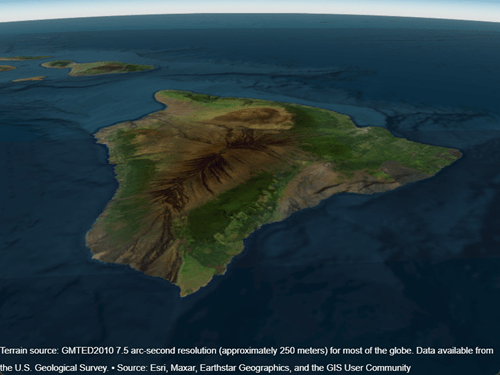
Query the latitude, longitude, and ellipsoidal height of the camera, and assign each to a variable.
[camlat,camlon,camh] = campos(g)
camlat =

   18.3172


camlon =

 -155.5891


camh =

   6.2692e+04
Query the heading, pitch, and roll angles of the camera, and assign each to a variable.
heading = camheading(g)
pitch = campitch(g)
roll = camroll(g)
heading =

    3.7590


pitch =

  -29.9880


roll =

  359.9993
Use these values to control the view of a different geographic globe. For example, create a new geographic globe and programmatically set the view.
uif2 = uifigure;
g2 = geoglobe(uif2);
campos(g2,camlat,camlon,camh)
camheading(g2,heading)
campitch(g2,pitch)
camroll(g2,roll)
In many cases, the camera view of the geographic globe changes when you plot new data. You can preserve the camera view by setting the camera modes to "manual" and the hold state to "on".
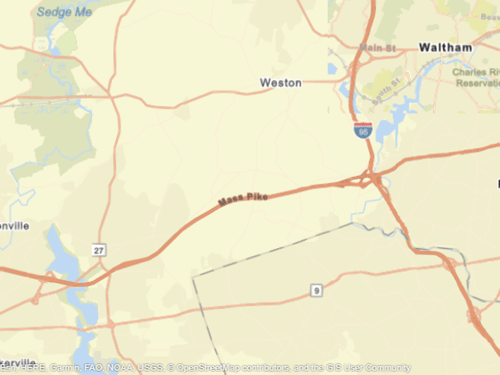
Read the buildings layer from an OpenStreetMap file [1] containing data for several city blocks in Shibuya, Tokyo, Japan. Display the buildings in a geographic globe with a road map and no terrain data.
GT = readgeotable("shibuya.osm",Layer="buildings");
addCustomBuildings("shibuya",GT)

uif = uifigure;
g = geoglobe(uif,Buildings="shibuya",Basemap="streets-light",Terrain="none");
Adjust the camera view by interacting with the globe.
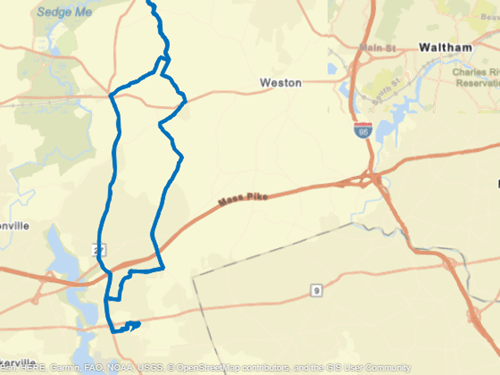
Read track points from a GPX file into a geospatial table. Extract the latitude and longitude coordinates from the geospatial table, and specify a height value for each coordinate.
track = readgeotable("shibuya_track.gpx",Layer="track_points");
lat = track.Shape.Latitude;
lon = track.Shape.Longitude;
height = linspace(10,100,length(lat));
Set the camera modes to "manual" and the hold state to "on". Then, plot the data. Note that the camera position does not change.
campos(g,"manual")
camheight(g,"manual")
camheading(g,"manual")
campitch(g,"manual")
camroll(g,"manual")
hold(g,"on")

geoplot3(g,lat,lon,height,"-o",LineWidth=3)
[1] You can download OpenStreetMap files from https://www.openstreetmap.org, which provides access to crowd-sourced map data all over the world. The data is licensed under the Open Data Commons Open Database License (ODbL), https://opendatacommons.org/licenses/odbl/.
Input Arguments
Output Arguments
Version History
Introduced in R2020b
1 Alignment of boundaries and region labels are a presentation of the feature provided by the data vendors and do not imply endorsement by MathWorks®.