wmpolygon
(To be removed) Display geographic polygon on web map
The wmpolygon function will be removed in a future release. Use a
geographic axes object, a geopolyshape
object, and the geoplot
function instead. For information on updating your code, see Version History.
Description
wmpolygon( displays a polygon overlay
based on the vector geographic features stored in P)P. The
overlay contains one polygon feature for each element of
P.
wmpolygon( displays
the overlay in the web map specified by the web map handle,
wm,___)wm.
wmpolygon(___,
specifies name-value pairs that set additional display properties.Name,Value)
h = wmpolygon(___)
Examples
Load the latitude and longitude coordinates of world coastlines from a MAT file. Display the coordinates using a polygon on a web map.
load coastlines
wmpolygon(coastlat,coastlon)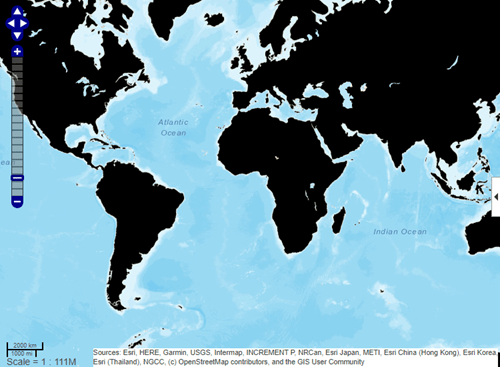
Input Arguments
Name-Value Arguments
Specify optional pairs of arguments as
Name1=Value1,...,NameN=ValueN, where Name is
the argument name and Value is the corresponding value.
Name-value arguments must appear after other arguments, but the order of the
pairs does not matter.
Before R2021a, use commas to separate each name and value, and enclose
Name in quotes.
Example: wmpolygon(lat,lon,'Autofit',true)
Overlay visibility, specified as the comma-separated pair consisting
of 'Autofit' and the scalar logical or numeric value
true (1) or
false (0).
If
true,wmpolygonadjusts the spatial extent of the map to ensure that all the vector overlays on the map are visible.If
false,wmpolygondoes not adjust the spatial extent of the map when this vector layer is added to the map.
Data Types: single | double | int8 | int16 | int32 | int64 | uint8 | uint16 | uint32 | uint64 | logical
Description of feature, specified as the comma-separated pair
consisting of 'Description' and a character vector,
cell array of character vectors, or a scalar structure.
If you specify a character vector, the text defines the content displayed in the description balloon, which appears when you click the feature in the web map. Description elements can be either plain text or marked up with HTML markup.
If you specify a cell array, it must be either a scalar or the same length as
P, and specifies the description for each polygon.If the value is a structure (attribute specification),
wmpolygondisplays the attribute fields ofPin the balloon, modified according to the specification.
Data Types: char | struct | cell
Name of overlay layer, specified as the comma-separated pair
consisting of 'OverlayName' and a character vector.
wmpolygon inserts the name in the Layer Manager
under the "Overlays" item. The Layer Manager is the tool that appears on
the right side of the web map. The default name is 'Polygon
Overlay where
N'N is the number assigned to this
overlay.
Data Types: char
Name of feature, specified as the comma-separated pair consisting of
'FeatureName' and character vector or cell array
of character vectors. The name appears in the balloon when you click the
feature in the web map. The default value is
', where
OverlayName: Polygon
K'OverlayName is the name of the overlay
and K is the number assigned to the
particular polygon.
If the value is a character vector, it applies to all features.
If the value is a cell array of character vectors, it must be either a scalar or the same length as
P.
Data Types: char | cell
Color of polygon faces, specified as the comma-separated pair
consisting of 'FaceColor' and one of these options.
A color name such as
'red'or a short name such as'r'.An RGB triplet, which is a three-element row vector whose elements specify the intensities of the red, green, and blue components of the color. The intensities must be in the range
[0,1]; for example,[0.4 0.6 0.7].A cell array of color names such as
{'red','green','blue'}or{'r','g','b'}.A string vector of color names such as
["red" "green" "blue"]or["r" "g" "b"].A matrix of RGB triplets, which is a three-column matrix in which each row is an RGB triplet.
The way you specify the color depends on the desired color scheme.
To apply the same face color to all polygons in
P, specify a single color name or RGB triplet.To apply a different color to each polygon in
P, specify a cell array of color names, a string vector of color names, or a matrix of RGB triplets. The number of colors and RGB triplets must match the length ofP.To create polygons with no fill, specify
'none'.
This table contains the color names and equivalent RGB triplets for some common colors.
| Color Name | Short Name | RGB Triplet | Appearance |
|---|---|---|---|
"red" | "r" | [1 0 0] |
|
"green" | "g" | [0 1 0] |
|
"blue" | "b" | [0 0 1] |
|
"cyan"
| "c" | [0 1 1] |
|
"magenta" | "m" | [1 0 1] |
|
"yellow" | "y" | [1 1 0] |
|
"black" | "k" | [0 0 0] |
|
"white" | "w" | [1 1 1] |
|
Data Types: char | string | cell | double
Transparency of polygon faces, specified as the comma-separated pair
consisting of 'FaceAlpha' and a numeric scalar or
vector in the range [0, 1]. The default value, 1,
means that the polygon is fully opaque.
If the value is a scalar, it applies to all polygon faces.
If the value is a vector, it must be the same length as
P.
Data Types: single | double | int8 | int16 | int32 | int64 | uint8 | uint16 | uint32 | uint64
Color of polygon edges, specified as the comma-separated pair
consisting of 'EdgeColor' and one of these options.
A color name such as
'red'or a short name such as'r'.An RGB triplet, which is a three-element row vector whose elements specify the intensities of the red, green, and blue components of the color. The intensities must be in the range
[0,1]; for example,[0.4 0.6 0.7].A cell array of color names such as
{'red','green','blue'}or{'r','g','b'}.A string vector of color names such as
["red" "green" "blue"]or["r" "g" "b"].A matrix of RGB triplets, which is a three-column matrix in which each row is an RGB triplet.
The way you specify the color depends on the desired color scheme.
To apply the same edge color to all polygons in
P, specify a single color name or RGB triplet.To apply a different edge color to each polygon in
P, specify a cell array of color names, a string vector of color names, or a matrix of RGB triplets. The number of colors and RGB triplets must match the length ofP.To create polygons with no edge color, specify
'none'.
This table contains the color names and equivalent RGB triplets for some common colors.
| Color Name | Short Name | RGB Triplet | Appearance |
|---|---|---|---|
"red" | "r" | [1 0 0] |
|
"green" | "g" | [0 1 0] |
|
"blue" | "b" | [0 0 1] |
|
"cyan"
| "c" | [0 1 1] |
|
"magenta" | "m" | [1 0 1] |
|
"yellow" | "y" | [1 1 0] |
|
"black" | "k" | [0 0 0] |
|
"white" | "w" | [1 1 1] |
|
Data Types: char | string | cell | double
Transparency of polygon edges, specified the comma-separated pair
consisting of 'EdgeAlpha' and as a numeric scalar or
vector in the range [0, 1].
If the value is a scalar, it applies to all polygon faces.
If the value is a vector, it must be the same length as
P.
Data Types: single | double | int8 | int16 | int32 | int64 | uint8 | uint16 | uint32 | uint64
Width of polygon edges, specified as the comma-separated pair
consisting of 'LineWidth' and a positive numeric
scalar or vector.
If the value is a scalar, it applies to all polygon faces.
If the value is a vector, it must be the same length as
P.
Data Types: single | double | int8 | int16 | int32 | int64 | uint8 | uint16 | uint32 | uint64
Output Arguments
Tips
When you move the cursor over the polygons you define on an image and click,
wmpolygondisplays a description balloon and disables panning. If you move the cursor off the polygon, you can still click and pan the image. You can also use the arrow keys to pan the image.
Version History
Introduced in R2016a1 Alignment of boundaries and region labels are a presentation of the feature provided by the data vendors and do not imply endorsement by MathWorks®.