Graphiques
Tracés 2D et 3D, images et animations
Les fonctions graphiques incluent des fonctions de tracé 2D et 3D permettant de visualiser les données et de communiquer les résultats. Il est possible de personnaliser les tracés de manière interactive ou programmatique.
Fondamentaux pour la représentation graphiques des données
Catégories
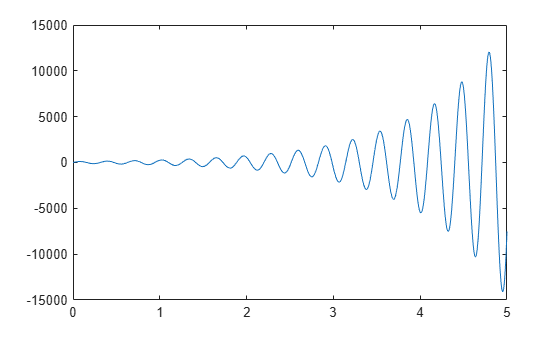
- Graphiques 2D et 3D
Tracer des données continues, discrètes, de surface et de volume
- Étiquettes et style
Choisir les couleurs, les annotations et les thèmes ; modifier les axes, contrôler les interactions des tracés
- Images
Lire, écrire, afficher et modifier des images
- Imprimer et enregistrer
Imprimer et exporter des figures vers des formats de fichiers standard
- Objets graphiques
Personnaliser les graphiques en définissant les propriétés des objets sous-jacents
- Performances graphiques
Optimiser le code pour améliorer les performances
Sélection d՚exemples
Spécifier les valeurs et les étiquettes de graduation d’un axe
Personnaliser les valeurs et les étiquettes de graduation le long d’un axe, par exemple en éditant le placement des valeurs de graduation ou en modifiant le texte et la mise en forme des étiquettes de graduation.

Colorer les barres 3D par hauteur
Cet exemple montre comment modifier un graphique à barres 3D en colorant chaque barre en fonction de sa hauteur.
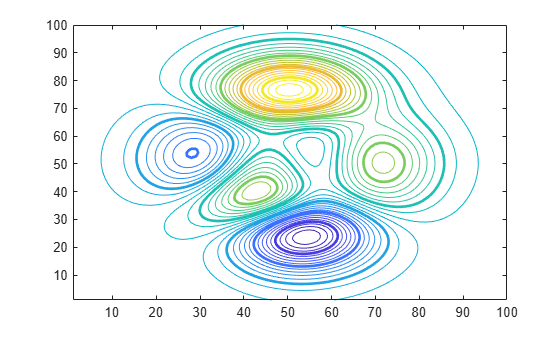
Mettre en évidence des niveaux spécifiques dans une courbe de niveau
Cet exemple montre comment mettre en évidence des niveaux spécifiques dans une courbe de niveau.