zoomInteraction
Zoom interaction
Description
A zoom interaction allows you to zoom into a chart without having to select any
buttons in the axes toolbar. To enable zooming, set the Interactions
property of the axes to a zoomInteraction object. When this interaction is
enabled, you can zoom by scrolling or pinching within the chart.
When this interaction is enabled on axes with focus, you can zoom the view of the axes using the keyboard. To zoom in, press the Plus (+) or Equal (=) key. To zoom out, press the Minus (-) key. (since R2024a)
To enable multiple interactions, set the Interactions property to an
array of objects.
Creation
Description
z = zoomInteraction creates a zoom interaction object.
z = zoomInteraction('Dimensions',d) sets the Dimensions property.
Use this property to constrain zooming to specific dimensions. For example, z =
zoomInteraction('Dimensions','x') constrains zooming to the
x-dimension.
Properties
Examples
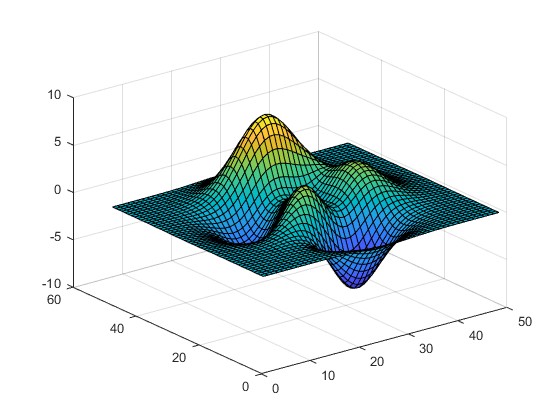
Create a surface plot. Get the current axes and replace the default interactions with just the zoom interaction. Then scroll or pinch to zoom in or out.
surf(peaks)
ax = gca;
ax.Interactions = zoomInteraction;
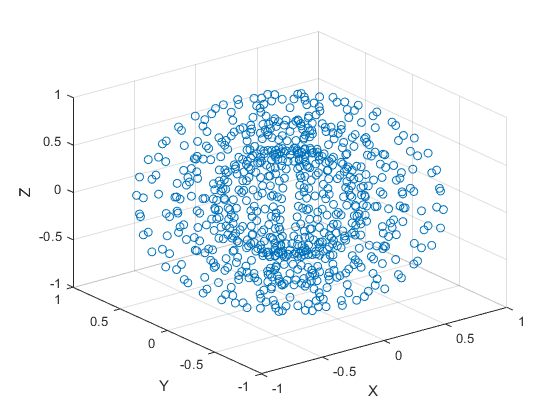
Use the sphere function to define vectors x, y, and z. Then create a scatter plot using those vectors. Replace the default set of interactions with a zoom interaction that is restricted to the x-dimension. Then scroll or pinch within the plot to zoom.
[X,Y,Z] = sphere(16);
x = [0.5*X(:);0.75*X(:);X(:)];
y = [0.5*Y(:);0.75*Y(:);Y(:)];
z = [0.5*Z(:);0.75*Z(:);Z(:)];
scatter3(x,y,z)
xlabel("X")
ylabel("Y")
zlabel("Z")
ax = gca;
ax.Interactions = zoomInteraction(Dimensions="x");
Tips
In most cases, the axes have a default set of interactions which depend on the type of chart you are displaying. You can replace the default set with a new set of interactions, but you cannot access or modify any of the interactions in the default set.