Create Lists of Figures and Tables in Report API Reports
In a Report API report, you can create a list of the figures or tables in a report so that you can browse the list and easily navigate to a particular figure or table. To create a list of figures, add an mlreportgen.report.ListOfFigures reporter to the report. To create a list of tables, add an mlreportgen.report.ListOfTables reporter to the report.
Note
To create a section for a list of other report elements, such as equations, use an mlreportgen.report.ListOfCaptions reporter.
A ListOfFigures or ListOfTables reporter creates a placeholder for a list in a new section of the report. Typically, you add a list of figures or a list of tables section after the table of contents and before the sections that contain the report content. In PDF and Microsoft® Word reports, the list of figures or tables sections are located where you put them in the report. In HTML reports, the sections are located in a sidebar.
The way the list of figures or tables is generated depends on the report type:
PDF — The Report API generates the list during report generation.
Word — You must generate the list by updating the Word document in your report generation program or interactively in Word. See Update Tables of Contents and Generated Lists in Word Documents.
HTML — The HTML browser generates the list.
A list of figures section includes a list of the captions of all of the images that are represented as mlreportgen.report.FormalImage or mlreportgen.report.Figure objects. A list of tables section includes a list of the titles of all of the tables that are represented as mlreportgen.report.BaseTable objects. Each list item in a list of figures or tables links to a caption or title in the report. In PDF and Word reports, a list item also includes the page number of the caption or title in the report. A leader fills the space between the caption or title and the page number.
Create List of Figures Section
To create a list of figures section in a report:
Create a Report API report.
Create a
ListofFiguresobject. The default title for the list of figure section isList of Figures. To specify a different title, set theTitleproperty of theListofFiguresobject. Add theListofFiguresobject to the report.Create chapters or sections for the report content.
Add report content to the chapters or sections. Create images as
FormalImageorFigureobjects. Specify the captions for images or figures. For aFormalImageobject, set theCaptionproperty. For aFigureobject, set theCaptionproperty of theFormalImageobject that is specified by theSnapShotproperty of theFigureobject.Close the report.
Create List of Tables Section
To create a list of tables section in a report:
Create a Report API report.
Create a
ListofTablesobject. The default title for the list of tables section isList of Tables. To specify a different title, set theTitleproperty of theListofTablesobject. Add theListofTablesobject to the report.Create chapters or sections for the report content.
Add report content to the chapters or sections. Create tables as
BaseTableobjects and specify the titles using theTitleproperty of the objects.Close the report.
Create a Report That Has a List of Figures and a List of Tables
This example shows how to add a list of figures section and a list of tables section to a Report API report. The example generates a report about magic squares that includes two figures and a table.
Import the Report and DOM API packages so that you do not have to use long, fully qualified class names.
import mlreportgen.report.*
import mlreportgen.dom.*
Create a Report API report. Add a title page and table of contents to the report.
rpt = Report('magic','docx');
tp = TitlePage;
tp.Title = 'Magic Squares';
tp.Author = 'John Doe';
append(rpt,tp);
append(rpt,TableOfContents);
Add a list of figures section and a list of tables section to the report. Use the default section titles.
lof = ListOfFigures();
append(rpt,lof);
lot = ListOfTables();
append(rpt,lot);
Create the report content. For this example, create a chapter for an introduction to magic squares and a chapter for an example of a magic square.
ch1 = Chapter('Introduction');
sec1 = Section('What is a Magic Square?');
para = Paragraph(['A magic square is an N-by-N matrix '...
'constructed from the integers 1 through N^2 '...
'with equal row, column, and diagonal sums.']);
append(sec1,para);
append(ch1,sec1);

sec2 = Section('Albrecht Durer and the Magic Square');
para = Paragraph(['A 4-by-4 magic square appears in the upper right corner ' ...
    'of the engraving, Melancholia I, by German artist Albrecht Durer (1471-1528).']);
append(sec2,para);
append(ch1,sec2) ;
Add an image durer.png to the chapter as an mlreportgen.report.FormalImage object so that the image is included in the list of figures.
im = FormalImage('durer.png');
im.Caption = 'Melancholia I by Albrecht Durer';
append(sec2,im);
append(rpt,ch1);
Create the second chapter.
ch2 = Chapter('Magic Square Example');
square = magic(10);
Create a table from the output of magic(10) and add it to the chapter. Represent the table as an mlreportgen.report.BaseTable so that the table is included in the list of tables.
tbl = BaseTable(square);
tbl.Title = 'Order Ten Magic Square';
append(ch2,tbl);
Create a color-coded image of the magic square and add it to the chapter as an mlreportgen.report.Figure object so that the image is included in the list of figures.
clf;
imagesc(square)
axis equal
axis off
fig = Figure(gcf);
fig.Snapshot.Caption = 'Color-coded image of 10-by-10 magic square';
append(ch2,fig);
append(rpt,ch2);

Close and view the report.
close(rpt);
rptview(rpt);
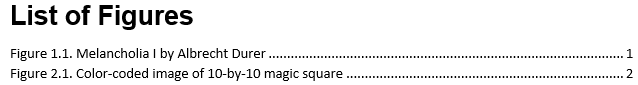
Here is the list of figures in the report:
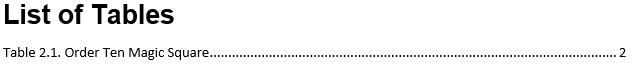
Here is the list of tables in the report:
Customize a List of Figures or Tables Section Title
You can specify the title of a list of figures or list of tables section by setting the Title property of the ListOfFigures or ListOfTables reporter. To customize the style of the title,such as the font family, color, or size, use one of these approaches:
Specify the title as an
mlreportgen.dom.Textobject and specify the style using the object properties.Specify the title style in the template used by the
ListOfFiguresorListOfTablesreporter.Specify the title style in the template used by the title reporter for the list of figures or tables section title. See Use a Custom Template for a List of Figures Title and Use a Custom Template for a List of Tables Title.
See Also
mlreportgen.report.BaseTable | mlreportgen.report.ListOfFigures | mlreportgen.report.ListOfTables | mlreportgen.report.ListOfCaptions | mlreportgen.report.FormalImage | mlreportgen.report.Figure