mlreportgen.report.Figure class
Package: mlreportgen.report
Superclasses: mlreportgen.report.Reporter
Figure reporter
Description
Create a figure reporter with a title, figure, and caption.
The mlreportgen.report.Figure
class is a handle
class.
Creation
Description
fig = mlreportgen.report.Figure()
creates a
reporter that makes a snapshot of the figure currently open in MATLAB® and adds it to a report. Use the figure properties to add a caption or
change the figure size. The snapshot image is stored in the temporary folder of the
report. When the report is closed, the snapshot image is copied into the report and the
image is deleted from the temporary folder. To prevent the snapshot image files from being
deleted, use the Debug
property of the report. See mlreportgen.report.Report
.
fig = mlreportgen.report.Figure(source)
creates a
reporter that adds the figure specified by source
and sets the
Source
property to source
.
fig = mlreportgen.report.Figure(Name=Value)
sets
properties using name-value pairs. You can specify multiple name-value pair arguments in
any order.
Properties
Snapshot
— Figure image
mlreportgen.report.FormalImage
object
Figure image, specified as an object of the
mlreportgen.report.FormalImage
reporter class. The reporter uses
gcf
to obtain the current MATLAB figure. It uses the formal image reporter to insert the figure into a
report. To specify the size of the snapshot or the caption, use the properties of the
FormalImage
object.
Note
The figure reporter initializes the Snapshot
property. Do not
reset this property.
Source
— Figure source
character vector | string scalar | graphics handle
Figure source, specified as a:
Character vector or string scalar that indicates the path to a valid figure file
Valid graphics handle
SnapshotFormat
— Snapshot image format
'svg'
(default) | 'bmp'
| 'jpg'
| 'png'
| 'emf'
| 'tif'
| 'pdf'
Snapshot image format, specified as a character vector or string scalar. Supported formats are:
'svg'
— Scalable Vector Graphics.'bmp'
— Bitmap image.'jpg'
— JPEG image.'png'
— PNG image.'emf'
— Enhanced metafile, supported only in DOCX output on Windows® platforms.'tif'
— Tag Image File format, not supported in HTML output.'pdf'
— PDF image (supported only in PDF output).
Scaling
— Scaling options for figure snapshot image
'auto'
(default) | 'custom'
| 'none'
Scaling options for the figure snapshot image, specified as a character vector or
string scalar. Scaling
controls the size of the figure snapshot
image in the image file. Supported scaling options are:
'auto'
— For PDF or Word (DOCX) output, scales the figure snapshot image to fit the current page layout while maintaining its aspect ratio. First, the figure snapshot image is scaled to the page width. If the image height exceeds the page height, the image is scaled down again. This additional scaling ensures that the image fits the current page with an extra one inch spacing. Scaling does not apply to HTML output.'custom'
— Scales the figure snapshot image based on the values of theHeight
andWidth
properties.When you set
Scaling
tocustom
and have large values for theHeight
andWidth
properties, ajava.lang.OutOfMemoryError
can occur during PDF generation. To avoid this error and ensure that the figure fits on the page, use smallerHeight
andWidth
values.'none'
— No sizing is performed
Note
The 'auto'
and 'custom'
options use the
MATLAB
print
command to resize the figure. If the figure is too large to
fit legibly in the specified space, the print
command crops the
snapshot image. To avoid cropping, you can specify 'none'
as the
value of the Scaling
option and use the reporter specified by the
Snapshot
property to size the figure image. This reporter
reduces the size of the text with the rest of the image and a user might need to zoom
the image in a viewer to discern fine detail. See Resize Figure Snapshot Image.
Height
— Height of snapshot image
character vector | string scalar
Height of snapshot image, specified as a character vector or string scalar that consists of a number followed by an abbreviation for a unit of measurement. For example, '2in' specifies two inches. Valid abbreviations are:
px
— pixels (default)cm
— centimetersin
— inchesmm
— millimeterspc
— picaspt
— points
Example: '2in'
Width
— Width of snapshot image
character vector | string scalar
Width of snapshot image, specified as a character vector or string scalar that consists of a number followed by an abbreviation for a unit of measurement. For example, '2in' specifies two inches. Valid abbreviations are:
px
— pixels (default)cm
— centimetersin
— inchesmm
— millimeterspc
— picaspt
— points
Example: '3in'
PreserveBackgroundColor
— Preserve figure background color
false (default) | true
Preserve the figure background color in the snapshot, specified as
true
or false
. If
PreserveBackgroundColor
is true
, the
background color of the snapshot is the same as the background color of the figure. If
PreserveBackgroundColor
is false
, the
background color of the snapshot is white.
TemplateSrc
— Source of template for this reporter
[]
(default) | character vector | string scalar | reporter or report | DOM document or document part
Source of the template for this reporter, specified as one of these options:
Character vector or string scalar that specifies the path of the file that contains the template for this reporter
Reporter or report whose template is used for this reporter or whose template library contains the template for this reporter
DOM document or document part whose template is used for this reporter or whose template library contains the template for this reporter
The specified template must be the same type as the report to which this
reporter is appended. For example, for a Microsoft® Word report, TemplateSrc
must be a Word reporter template. If
the TemplateSrc
property is empty, this reporter uses the default
reporter template for the output type of the report.
TemplateName
— Name of template for this reporter
character vector | string scalar
Name of template for this reporter, specified as a character vector or string scalar.
The template for this reporter must be in the template library of the template source
(TemplateSrc
) for this reporter.
LinkTarget
— Hyperlink target for this reporter
[]
(default) | character vector | string scalar | mlreportgen.dom.LinkTarget
object
Hyperlink target for this reporter, specified as a character vector or string scalar
that specifies the link target ID or as an mlreportgen.dom.LinkTarget
object. A character vector or string scalar
value is converted to a LinkTarget
object. The link target immediately
precedes the content of this reporter in the output report.
Methods
Public Methods
getSnapshotImage | Get snapshot image path |
mlreportgen.report.Figure.getClassFolder | Figure class definition file location |
mlreportgen.report.Figure.createTemplate | Create figure template |
mlreportgen.report.Figure.customizeReporter | Create custom figure reporter class |
copy | Create copy of reporter object and make deep copies of certain property values |
getImpl | Get implementation of reporter |
Examples
Add a Figure to a Report
Add a figure of a surface plot to a report and set the figure caption and height.
import mlreportgen.report.* surf(peaks); rpt = Report('peaks'); chapter = Chapter(); chapter.Title = 'Figure Example'; add(rpt,chapter); fig = Figure(); fig.Snapshot.Caption = '3-D shaded surface plot'; fig.Snapshot.Height = '5in'; add(rpt,fig); delete(gcf); rptview(rpt);
Add Multiple Figures to a Report Page
Add two figures to a report. To place them next to each other on the page, use a DOM Table object.
import mlreportgen.report.* import mlreportgen.dom.* rpt = Report('peaks'); surf(peaks(20)); figure = Figure(); peaks20 = Image(getSnapshotImage(figure,rpt)); peaks20.Width = '3in'; peaks20.Height = []; delete(gcf); surf(peaks(40)); figure = Figure(); peaks40 = Image(getSnapshotImage(figure,rpt)); peaks40.Width = '3in'; peaks40.Height = []; delete(gcf); t = Table({peaks20,peaks40;'peaks(20)','peaks(40)'}); add(rpt,t); close(rpt); rptview(rpt);
Resize Figure Snapshot Image
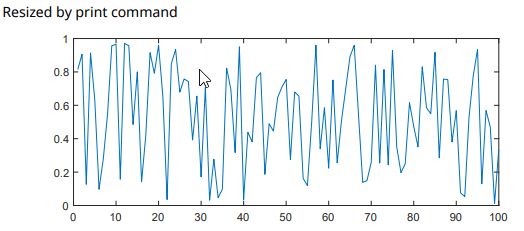
This example generates a PDF report that illustrates the difference between resizing a figure snapshot image using the print
command and resizing using the reporter specified by the Snapshot
property of the Figure
reporter.
Create a wide MATLAB® figure. Create three mlreportgen.report.Figure
reporters from the figure and add them to a report.
The first
Figure
reporter does not resize the figure.The second
Figure
reporter uses theprint
command to resize the figure.The third
Figure
reporter uses theSnapshot
reporter to resize the figure.
import mlreportgen.report.* fig = figure(); ax = axes(fig); plot(ax, rand(1,100)); pos = fig.Position; fig.Position = [pos(1) pos(2) 2*pos(3) pos(4)]; rpt = Report('example','pdf'); add(rpt, "Intrinsic figure size"); figReporter0 = Figure(fig); figReporter0.Scaling = 'none'; add(rpt,figReporter0); add(rpt, "Resized by print command"); figReporter1 = Figure(fig); add(rpt,figReporter1); add(rpt, "Resized by snapshot reporter"); figReporter2 = Figure(fig); figReporter2.Scaling = 'none'; figReporter2.Snapshot.ScaleToFit = true; add(rpt,figReporter2);
close(rpt); delete(fig) rptview(rpt);
Here are the figures in the generated report:
Version History
Introduced in R2017bR2019b: Default value of SnapshotFormat
is 'svg'
for all report types
Starting in R2019b, Scalable Vector Graphics (SVG) images are supported for Word reports. For
all report types (HTML, PDF, and Word), the default value of the
SnapshotFormat
property is 'svg'
and a value of
'auto'
indicates 'svg'
. In previous releases, the
default value of the SnapshotFormat
property was
'auto'
, which indicated 'svg'
for HTML and PDF
reports and 'emf'
or 'png'
for Word reports, depending
on the platform.
Word reports that contain SVG images require Word 2016 or a later version. In MATLAB R2019b or a later release, to generate a report with images that are
compatible with earlier versions of Word, set the SnapshotFormat
property to a value other than 'svg'
. To specify the image format used by
default in earlier releases of MATLAB, set SnapshotFormat
to:
'emf'
for a Windows platform'png'
for a UNIX® or Mac platform
Ouvrir l'exemple
Vous possédez une version modifiée de cet exemple. Souhaitez-vous ouvrir cet exemple avec vos modifications ?
Commande MATLAB
Vous avez cliqué sur un lien qui correspond à cette commande MATLAB :
Pour exécuter la commande, saisissez-la dans la fenêtre de commande de MATLAB. Les navigateurs web ne supportent pas les commandes MATLAB.
Select a Web Site
Choose a web site to get translated content where available and see local events and offers. Based on your location, we recommend that you select: .
You can also select a web site from the following list:
How to Get Best Site Performance
Select the China site (in Chinese or English) for best site performance. Other MathWorks country sites are not optimized for visits from your location.
Americas
- América Latina (Español)
- Canada (English)
- United States (English)
Europe
- Belgium (English)
- Denmark (English)
- Deutschland (Deutsch)
- España (Español)
- Finland (English)
- France (Français)
- Ireland (English)
- Italia (Italiano)
- Luxembourg (English)
- Netherlands (English)
- Norway (English)
- Österreich (Deutsch)
- Portugal (English)
- Sweden (English)
- Switzerland
- United Kingdom (English)