Apply Parameter Variation to Cells in Module
This example shows how to specify a parameter variation between the individual cell models in a battery block that you generate using Simscape™ Battery™ objects and functions. When you need a high-fidelity model of a battery, to achieve high accuracy, you must consider the deviations between individual cells. This deviation can be random, for example, due to manufacturing tolerances, or specific to individual cells, for example, if the state of health (SOH) varies between cells. The battery blocks that you generate with Simscape Battery support the specification of a variation in the parameters at different design levels.
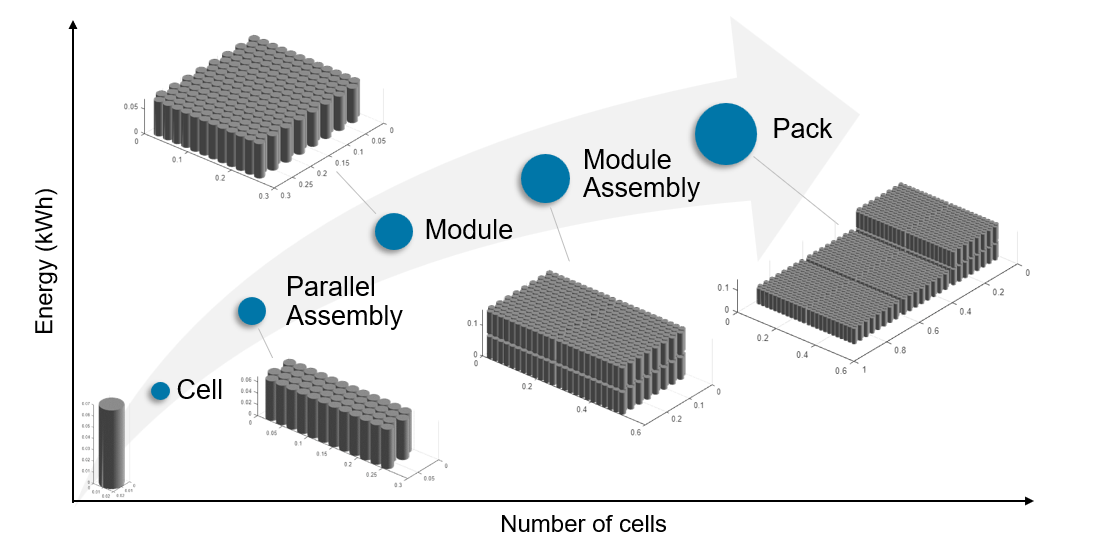
You can design a battery by using the functions and objects in the simscape.battery.builder package or with the Battery Builder app. In the tool, the battery comprises a maximum of four design levels with an increasing number of cells. Each level is composed of elements from the level below. This figure shows the design levels of a battery in ascending order.
The battery blocks that you generate using the buildBattery function represent these design levels. Simulink subsystems model the Pack (Generated Block) and ModuleAssembly (Generated Block) blocks that, in turn, contain Module (Generated Block) and ParallelAssembly (Generated Block) blocks. You can parameterize each Module block in these battery systems with different values, which results in a different behavior for each Module block.
If you want a more granular variation, you can specify a percentage deviation for the children of the Module and Parallel Assembly blocks. To enable this option, set the CellParameterVariation property of the specific object to PercentDeviation.
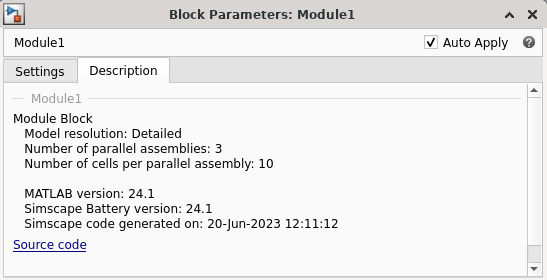
Open the DetailedModulePercentDeviation_lib library, which was generated for a module using the buildBattery function. Double-click the Module block to open the Block Parameters window. Because the CellParameterVariation property of the Module object is PercentDeviation, the software associates a percentage deviation parameter with each corresponding parameter. Each element of this parameter represents the deviation of the parameter for one specific cell model in the module.

Set Percentage Deviation Parameter
The number of cell models in the battery and the model resolution define the size of the percentage deviation parameter. The model resolution defines how many cells an individual cell model represents.
For a Module, you can set ModelResolution to one of these values:
Detailed— An individual cell model represents each cell in the module.Grouped— The number of cell models is equal to the sum of the values in theSeriesGroupingproperty of theModuleobject.Lumped— A single cell model represents all the cells in the module. You cannot specify a percentage deviation for a battery with a lumped resolution.
For batteries with a grouped or a lumped model resolution, you can specify the percentage deviation factor of the cell parameters as a numerical array. For each cell model, the cell percentage deviation contains one element. The elements are vertically concatenated.
Specify Percentage Deviation for Detailed Module
Simulate the behavior of a battery when the individual cells have a variation in the capacity. Manufacturing inaccuracies or different values of the SOH of the batteries can cause this variation. In this example, you use random values of a normal distribution with a standard deviation of three.
The detailed module comprises three parallel assemblies with 10 cells. A unique cell model represents every cell in the battery, for a total of 30 cell models. The percentage deviation parameter is a column vector with a length of 30. You can review the design of the battery in the Description tab of the Block Parameters window of the block.
open_system("DetailedModuleDischarge");
capacityPercentDeviation = [-3.27;0.1;1.66;3.3;4.63;0.26;-4.47; ...
    -2.23;-3.18;7.05;-1.85;2.24;-0.58;2.67;-2.29;-4.21;-4.27; ...
    1.46;-0.53;-0.59;4.26;0.87;0.59;4.76;-2.41;2.09;2.51;-0.73; ...
    0.65;-3.5];
set_param("DetailedModuleDischarge/Module1",BatteryCapacityCellPercentDeviation="capacityPercentDeviation");
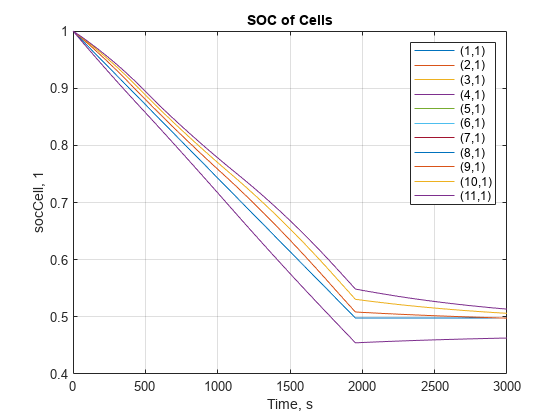
Simulate the model. The simulation results of a controlled discharge of the battery show the different state-of-charge (SOC) behavior of the cells.
simout = sim("DetailedModuleDischarge");
timeSeries = simout.simlog.Module1.socCell.series;
plot(timeSeries.time,timeSeries.values);
xlabel("Time (s)");
ylabel("SOC");
title("SOC of Cells");

Specify Percentage Deviation for Grouped Module
Simulate the behavior of a battery when three cells inside a module have a reduced capacity of 90%, 85% and 80% due to aging mechanisms. The module again comprises three parallel assemblies with 10 cells each. The first three cells of the third parallel assembly are the aged cells with reduced capacity.
You must individually model the cells with varying capacity in the third parallel assembly. The cells in the first two parallel assemblies behave similarly. Therefore, apply a grouped model resolution to the module, where you lump together the first two parallel assemblies and specify a detailed model resolution for the third parallel assembly. You can review the grouping strategy in the Description tab in the Block Parameters window of the generated block.

A single cell model represents the first two parallel assemblies. Therefore, the first element of the vector of the cell capacity deviation applies to the cells of both parallel assemblies. Because the cells in these parallel assemblies are new, the percentage deviation factor is zero. The next three elements of the vector represent the aged cells in the third parallel assembly. The last seven elements of the vector represent the remaining unaged cells in the third parallel assembly.
open_system("GroupedModuleDischarge");
groupedCapacityDeviation = [0; -10; -15; -20; 0; 0; 0; 0; 0; 0; 0];
set_param("GroupedModuleDischarge/Module1",BatteryCapacityCellPercentDeviation="groupedCapacityDeviation");
Simulate the model. The SOC of the cells in a controlled discharge shows four different behaviors. The cell with the highest SOC during the discharge represents the unaged cells in the first parallel assemblies. The second, third, and fourth elements represent the aged cells with the 10%, 15%, and 20% reduction in SOC, respectively. The remaining elements overlap and represent the remaining cells in the third parallel assembly. The unaged cells in the third parallel assembly partially compensate for the aged cells and, after the discharge concludes, the SOC balances between the cells.
simout = sim("GroupedModuleDischarge");
simout.simlog.Module1.socCell.plot;
title("SOC of Cells");

Specify Percentage Deviation for Array Parameters
Simulate the behavior of a battery with an increased internal resistance due to calendar aging. A Battery Equivalent Circuit block models the cell, where the R0Cell parameter represents the SOC-dependent internal resistance as a vector. Because the deviation of differs at individual SOC values, you must define a unique percentage deviation factor for each element of the R0Cell vector. This case differs from the previous section, in which you specify a scalar deviation factor for all values of the underlying parameter.
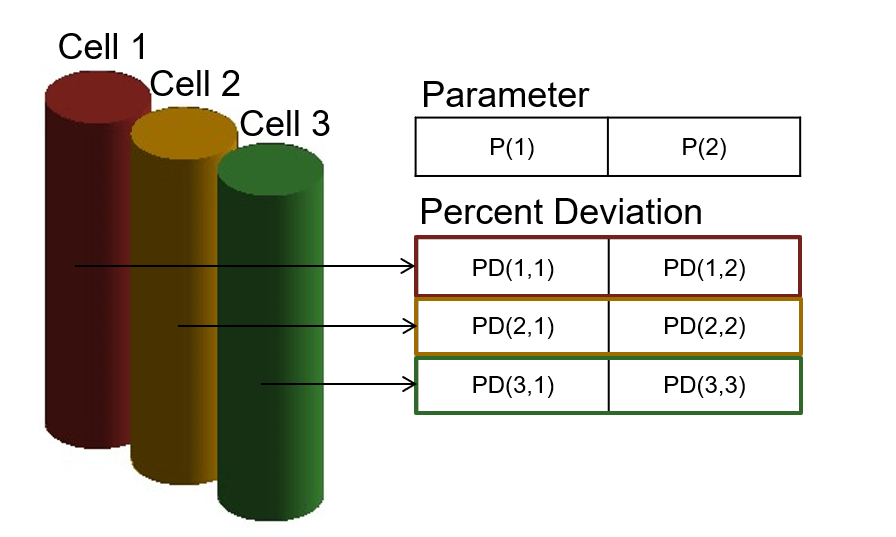
This figure shows how to specify the individual percentage deviations for each element of a parameter. The underlying parameter is a two-elements row vector. The battery contains three individual cell models. To define an individual percentage deviation of each parameter element of each cell, the resulting percentage deviation array must have a size of 3-by-2. The row number of an element in the percentage deviation parameter defines which cell model it applies to. The column number defines which element of the parameter it applies to.
For example, this equation defines the first element of the Cell1Parameter parameter in the first cell model:
In this example, the underlying R0Cell has a size of 1-by-7 and the Module block contains 11 cell models. The resulting percentage deviation R0CellPercentDeviation is an 11-by-7 matrix. Implement an internal resistance percentage deviation for the second, third, and fourth cell models, which already have a capacity percent deviation. In this case, to define an increase in the resistance, you specify the values of the second, third, and fourth rows of the internal resistance percentage deviation parameter as positive scalars.
open_system("GroupedModuleDischarge");
groupedResistanceDeviation = zeros(11,7);
groupedResistanceDeviation([2,3,4],:) = [79.428 52.854 31.122 16.566 60.198 26.298 65.408; ...
    119.142 46.684 79.28 24.848 90.298 39.446 98.112; ...
    158.856 62.244 105.706 33.13 120.396 52.594 130.816];
set_param("GroupedModuleDischarge/Module1",R0CellPercentDeviation="groupedResistanceDeviation");
Simulate the model. The module discharges with a constant current and then rests for a period of time. Because of the increased internal resistance, the SOC of the second, third, and fourth cell models now decrease at a slower rate than the other cells. Cell models from 5 to 11 represent the unaged cells in the same parallel assembly, which compensate for the reduced discharge of the aged cells. The SOC falls at a significantly higher rate for these cell models. The first cell model represents the unaged cells in the first and second parallel assemblies. The SOC curve locates between those of the third inhomogeneous parallel assembly.
simout = sim("GroupedModuleDischarge");
simout.simlog.Module1.socCell.plot;
title("SOC of Cells");
See Also
Module | Module (Generated
Block)