TimeScope Properties
Time scope UI components display time-domain signals in an app. Use the uitimescope
function to create a time scope in an app. By changing property values, you can modify the
appearance and behavior of a time scope. Use dot notation to query and set
properties.
fig = uifigure;
s = uitimescope(fig);
t = s.XTimeSpan;
s.Title = "My Data";
Time Scope
Length of the x-axis range, in seconds, specified as a positive value. As
new data displays in the time scope, the limits of the
x-axis change to reflect the data. The value of
XTimeSpan specifies how much data the time
scope displays at any time.
Data Types: single | double | int8 | int16 | int32 | int64 | uint8 | uint16 | uint32 | uint64
Legend visibility, specified as "on" or "off",
or as numeric or logical 1 (true) or
0 (false). A value of "on" is
equivalent to true, and "off" is equivalent to
false. Thus, you can use the value of this property as a logical
value. The value is stored as an on/off logical value of type matlab.lang.OnOffSwitchState.
When this property is set to "on", the legend is visible in the
scope.
Text for the legend labels, specified as a string array, cell array of character vectors, or categorical array. Each element of the array corresponds to a different signal displayed in the scope.
Example: ["MySignal1","MySignal2"]
Example: {'MySignal1','MySignal2'}
Type of plot, specified as 'line', 'stairs', or
'stem'.
This table describes each of the plot types and when to use each type.
| Value | Use | Appearance |
|---|---|---|
'line' | Visualize continuous signals. |
|
'stairs' | Visualize discrete signals. |
|
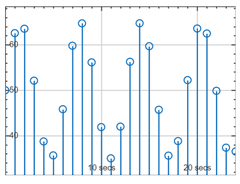
'stem' | Visualize frequency of signal values. |
|


Length of buffered data, specified as a positive integer. The buffer length
determines how much of the plotted data you can interact with after the signal is
generated during simulation. For example, if BufferLength is
10000, after the simulation is complete, you can view and interact
with the 10,000 most recent signal samples in the plot.
You cannot change this property while the simulation is generating signal data.
Labels
Rulers
Grids
Position
Interactivity
Callbacks
Callback Execution Control
Parent/Child
Identifiers
Version History
Introduced in R2024a