Simulink.sdi.getVisualization
Description
Examples
Suppose you want to visualize route and speed data in the Simulation Data
using a map visualization, an XY plot of the longitude and latitude data, and a time
plot of the speed data. You can use the
Simulink.sdi.setVisualization function and the
Simulink.sdi.getVisualization function to programmatically set
and get the visualization type for a subplot. For more information about the route and
speed data used in this example, see View and Replay Map Data.
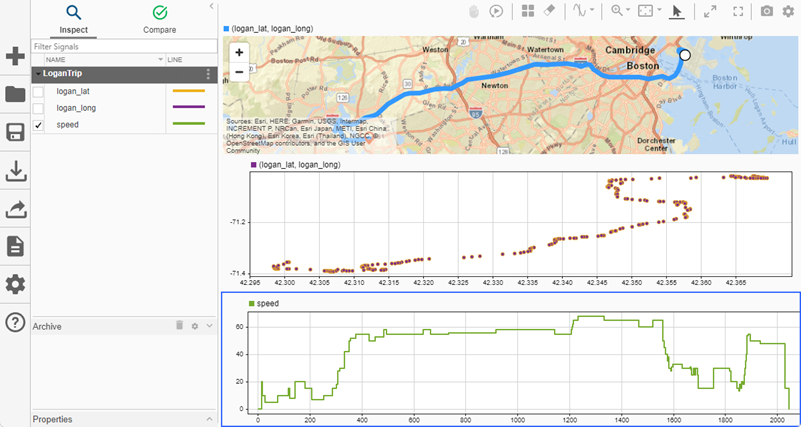
When subplots are in a grid layout, use the row and column indexing of each subplot to set the visualization type. For example, using a 3-by-1 subplot layout, set the top subplot to a map visualization, the middle subplot to an XY plot, and the bottom subplot to a time plot. Then, plot the data.
Simulink.sdi.setVisualization(1,1,"map");
Simulink.sdi.setVisualization(2,1,"xy");
Simulink.sdi.setVisualization(3,1,"timeplot");
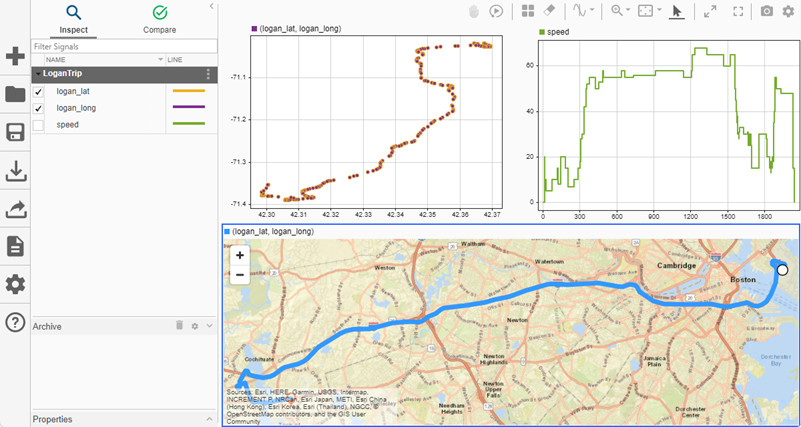
You can also set the visualization type when using a split three-plot basic layout. For example, using a split top three-plot layout, set the top-left subplot to an XY plot, the top-right subplot to a time plot, and the bottom subplot to a map. Then, plot the data.
Simulink.sdi.setVisualization(1,1,"xy");
Simulink.sdi.setVisualization(1,2,"timeplot");
Simulink.sdi.setVisualization(2,1,"map");
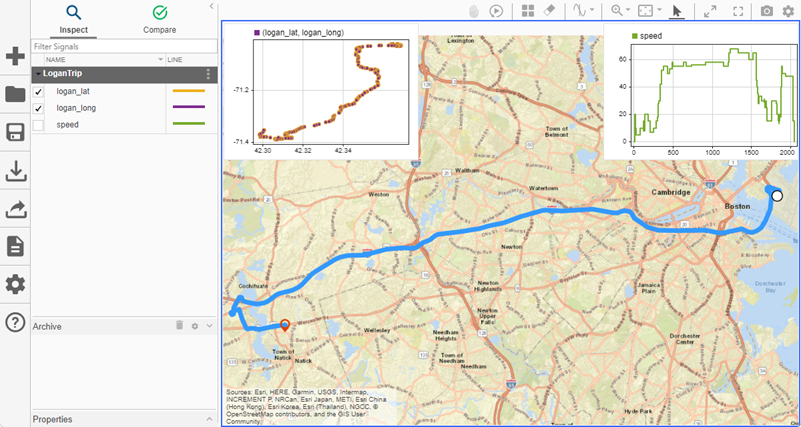
When you use an overlay subplot layout, the indexing remains the same regardless of the orientation. Consider an overlay layout with the overlays located at the top of the main subplot. Set the main subplot to a map visualization, the top-left overlay to an XY plot, and the top-right overlay to a time plot.
Simulink.sdi.setVisualization(1,1,"map");
Simulink.sdi.setVisualization(1,2,"timeplot");
Simulink.sdi.setVisualization(2,1,"xy");
Change the position of the overlays so that they are on the right side of the main plot.
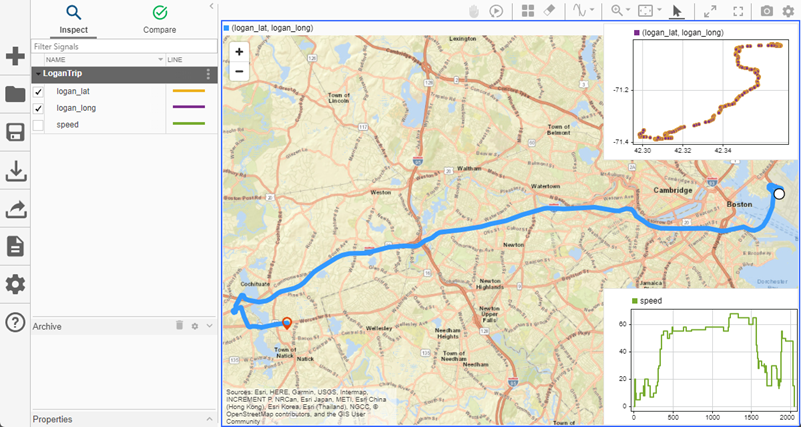
Use the Simulink.sdi.getVisualization function to get the visualization
type for each subplot.
mapVis = Simulink.sdi.getVisualization(1,1)
xyVis = Simulink.sdi.getVisualization(2,1)
timeVis = Simulink.sdi.getVisualization(1,2)
mapVis =

    'map'


xyVis =

    'xy'


timeVis =

    'timeplot'
Input Arguments
Output Arguments
Version History
Introduced in R2024b