Debug Simulation of Iterator Subsystem
Iterator subsystems repeat the execution of the algorithm modeled inside the subsystem one or more times within a simulation time step. To analyze or debug the algorithm inside an iterator subsystem, you need to pause within a time step when the iterator subsystem executes and step the simulation block by block or iteration to iteration.
This example shows how to analyze a simple summing algorithm implemented using a while-iterator subsystem.
Open Model and Set Up Debugging Tools
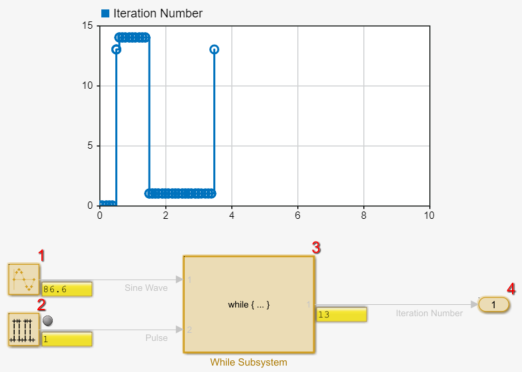
The model IterateSum uses a while-iterator subsystem to implement an iterative summing algorithm. The while-iterator subsystem has two inputs: a sine wave signal and a pulse signal. The pulse provides the initial logical condition that enables or disables the while-iterator subsystem in each time step. A Dashboard Scope block is connected to the signal Iteration Number to display the output of the while-iterator subsystem.
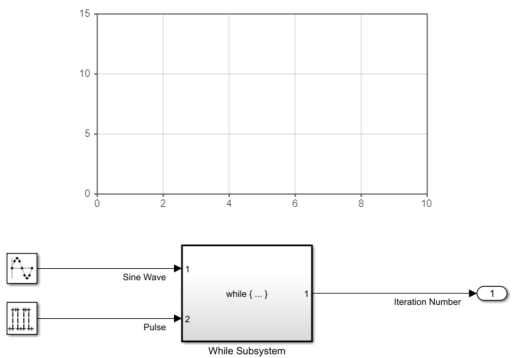
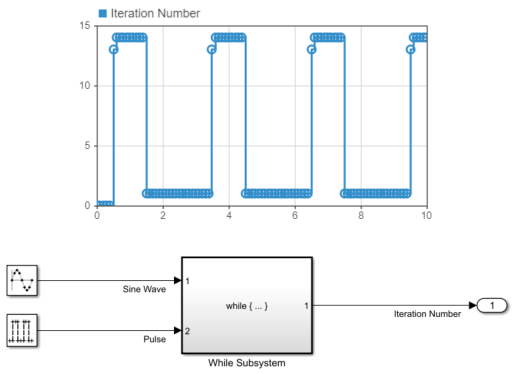
To simulate the model, in the Simulink® Toolstrip, on the Simulation tab, click Run. The Dashboard Scope displays the output of the While Subsystem block.
To analyze the algorithm implemented in the while-iterator subsystem and understand the output signal, you can use low-level debugging options, such as stepping block by block and signal breakpoints. Before starting the next simulation, set up the relevant debugging tools.
Check that the simulation mode is set to
Normalin the model. On the Simulation tab or the Debug tab, in the Simulate section, check that the Simulation mode list selection isNormal.Check that low-level debugging is enabled. On the Debug tab, in the Breakpoints section, click Breakpoints List. In the Breakpoints List, check that Pause within time step is selected.
To save time in iterative debugging simulations, enable fast restart. On the Simulation tab, in the Simulate section, click Fast Restart.
To view signal values in the block diagram, add port value labels. Click an empty area in the upper left of the canvas and drag to select everything in the block diagram. Then, on the Debug tab, in the Tools section, in the Port Values button group, click Show port value label on selected signal
 . After you add the port value labels, each signal shows no data yet until the simulation advances to a point that provides a new value to the port value label.
To view the execution order while stepping block by block, open the Execution Order viewer. In the Breakpoints List, click Open the Execution Order Viewer
 .
.
Set Breakpoint to Pause Simulation
To pause the simulation at a point of interest, set a breakpoint. When low-level debugging is enabled, the simulation pauses within the time step as soon as the condition for the breakpoint is met.
For example, to pause just before the pulse signal enables the while-iterator subsystem,
set a breakpoint on the output of the Pulse block. The while-iterator
subsystem executes only when the value of the signal named Pulse has a
value other than 0. Configure the breakpoint to pause the simulation just
before the while-iterator subsystem executes, each time the signal named
Pulse enables the while-iterator subsystem.
Select the signal
Pulse.On the Debug tab, in the Breakpoints section, click Add Breakpoint.
In the Add Breakpoint dialog box, configure the breakpoint to pause the simulation when the Pulse block output value becomes greater than zero. From the drop-down list, select
>and then enter0in the box.
The red circle on the signal line indicates the active signal breakpoint.

Step Block by Block
To start analyzing the model, run a simulation. In the Simulink® Toolstrip, on the Debug tab, click Run.
When the simulation reaches a time of 0.5 seconds, the
Pulse signal value becomes 1. The simulation pauses
on the breakpoint just after the Pulse block executes and updates the output
value. When the simulation pauses within the time step:
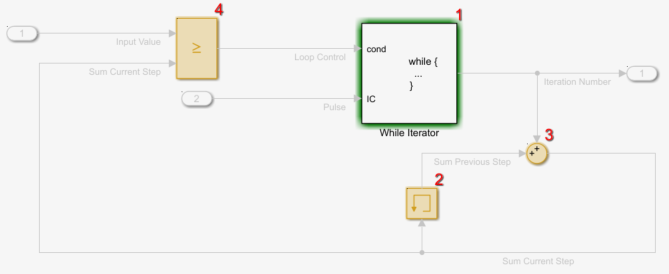
The Execution Order viewer annotates the block diagram with the execution order for the task in which the simulation pauses and displays the execution order for that task as a list.
The port value label for the signal
Pulseshows the signal value that satisfied the breakpoint condition.A green arrow on the breakpoint, the status string in the status bar, and the highlighted row in the Breakpoints List indicate that the simulation paused because of the breakpoint.
The green highlight on the Pulse Generator block, the highlighted row in the Execution Order viewer, and the status string in the status bar indicate that the simulation paused on the Pulse Generator block.
To advance the simulation through the breakpoint and pause just before executing the next block, in the Debug tab, click Step Over. The green highlight moves to the while-iterator subsystem, and the green arrow on the breakpoint disappears.

To see the number of iterations the while-iterator subsystem executes in this time step,
click Step Over again. Because the while-iterator subsystem is
nonvirtual, the Step Over action steps over the entire subsystem as a
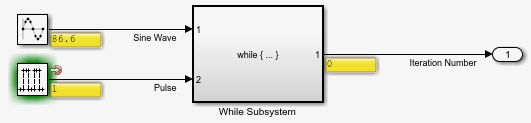
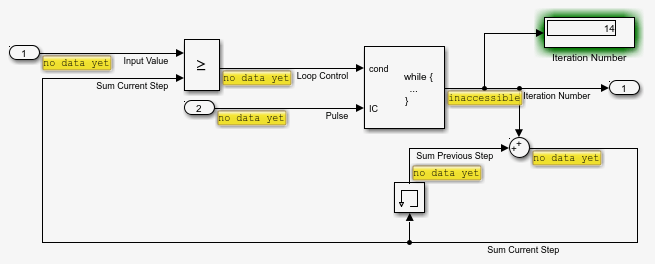
single unit. The port value label updates to show that the while-iterator subsystem executed
the algorithm 13 times for an input value of 86.6.

If you click Step Over one more time, the Outport
block executes, and the Dashboard Scope block updates to show the new value
for the Iteration Number signal.
If you continue clicking Step Over, you can step through the
block-by-block execution in subsequent time steps. The Pulse signal value
stays 1 for the next several time steps.
Each time the simulation pauses on the Pulse Generator block after you click Step Over, clicking Step Over again causes the simulation to pause on the breakpoint. The first time the simulation pauses on the Pulse Generator block, the simulation pauses just before the block executes to produce a new output value. The simulation subsequently pauses on the breakpoint because the signal breakpoint condition is met when the Pulse Generator block executes.
Step into While-Iterator Subsystem
To advance the simulation until the next time the while-iterator subsystem is enabled,
in the Debug tab, click Continue. If you did not
continue stepping block by block until the Pulse Generator block output value
changed to 0, continue clicking Continue until the
simulation reaches a time of 1.5 seconds and pauses on the
breakpoint.
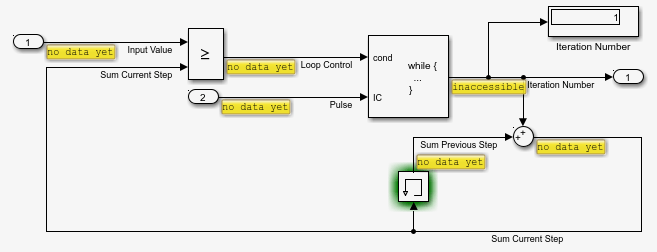
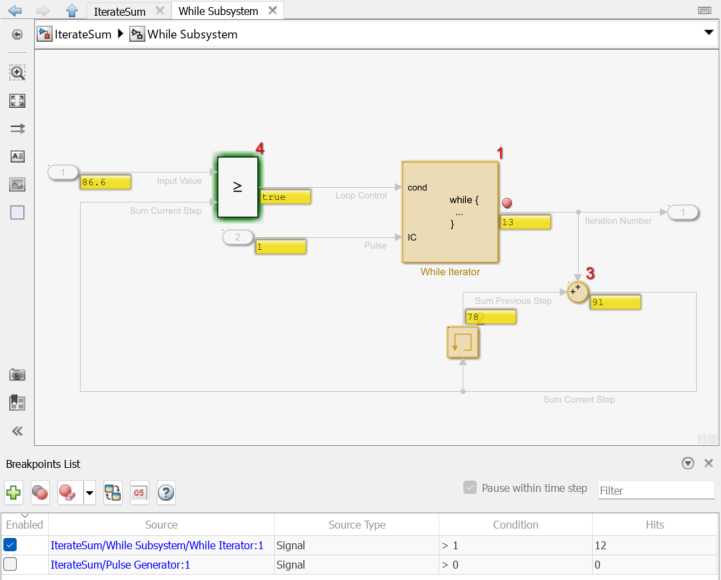
To advance the simulation to the while-iterator subsystem, click Step Over. Then, to observe the algorithm execution, click Step In. The model canvas navigates inside the while-iterator subsystem. The simulation pauses on the While Iterator block.
To see the signal values as you step through the algorithm implemented in the while-iterator subsystem, add port value labels.
Click an empty area in the upper left of the canvas and drag to select everything in the block diagram.
On the Debug tab, in the Tools section, in the Port Values button group, click Show port value label on selected signal
 .
.
The port value label for the iteration number output from the While
Iterator block shows the iteration number from the last time step in which the
while-iterator subsystem executed. Each port value label on the other signals shows
no data yet until the simulation advances to a point that provides a
new value to that port value label.
Before R2024b: Port value labels do not support displaying
values for the iteration number port, so the port value label shows
inaccessible. To view the iteration number in the block diagram, add a
Display block to the model. Then, connect the
iteration port output to the Display block.
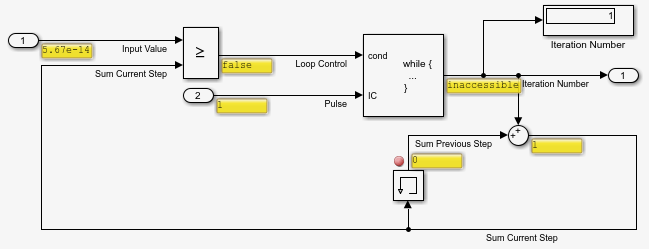
Click Step Over. The iteration number signal value changes to
1, as indicated in the port value label. The simulation pauses on the
Memory block, which is next in the execution order.
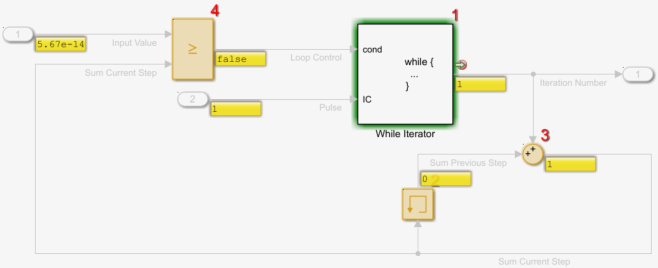
As you click Step Over two more times, the simulation pauses on the
Sum block then the Relational Operator block. When you click
Step Over again, the canvas updates to show the top level block
diagram because the while-iterator subsystem executes only once in this time step. When you
click Step Over once more, the Dashboard Scope block
plots the new value for the Iteration Number signal.
Pause on Specific Iteration
To pause the simulation on a particular iteration, add a breakpoint on the signal produced by the iteration number output port. If your model does not use the iteration number output port, expose the port on the While Iterator block by selecting the Show iteration number port block parameter.
Before R2024b: Setting a breakpoint on the iteration number output is not supported.
For example, suppose you want to analyze the algorithm for a time step in which the
while-iterator subsystem algorithm executes more than once. Add a signal breakpoint to the
iteration number output of the While Iterator block to pause simulation when
the value is greater than 1.
To navigate inside the while-iterator subsystem, double-click the block in the model.
Right-click the output of the While Iterator block, and then click Add Breakpoint
 .
.Note
By default, clicking a signal line during simulation toggles whether the signal has a port value label. If you click the signal line to add a breakpoint and the port value label disappears, click the signal again to add the port value label back. The port value label shows
no data yetuntil the simulation advances to a point that provides a new value to the port value label. The software does not retain data for removed port value labels.In the Add Breakpoint dialog box, configure the breakpoint condition so the simulation pauses when the iteration number value becomes greater than
1. From the drop-down list, select>and then enter1in the box.
To progress simulation directly to the first time the while-iterator subsystem executes
more than once, disable the breakpoint on the Pulse signal. In the
Breakpoints List, in the Enabled column, clear the check
box for the row that corresponds to the breakpoint on the Pulse
signal.

To advance the simulation until the next time step in which the while-iterator subsystem
executes more than once, on the Debug tab, click
Continue. The simulation runs to a time of 3.5
seconds and pauses on the breakpoint on the iteration number output. The port value label
for the iteration number output shows a value of 1. The other port value
labels display the value from the last time the while-iterator subsystem executed.
Continue clicking Step Over to step through the algorithm block by block. The while-iterator subsystem continues to execute so long as the cumulative sum is less than the input value from the Sine Wave block.
Because the simulation pauses on the breakpoint in each iteration, you can use the
Continue button to step through the simulation one iteration at a
time. Click Continue until the port value label on the iteration port
output shows 13. Then, click Step Over twice to
pause the simulation on the Relational Operator block.
On the 13th iteration, the cumulative sum becomes 91, which is
greater than the input value of 86.6. The port value label for the output
of the Relational Operator block shows a value of true
because the block has not executed yet. The Hits column in the
breakpoints list shows the number of times the simulation paused on the iteration number
breakpoint.
When you click Step Over once more, the Relational Operator block executes, and the simulation exits the while-iterator subsystem loop. The model canvas navigates back to the top-level view of the model. To advance the simulation through the remainder of the current time step, click Step Forward. The Outport block executes, and the plot in the Dashboard Scope block updates to show the value from this time step.
End Simulation Debugging Session
When you are done analyzing and debugging your model, you can end the simulation debugging session in one of several ways, depending on what you plan to do next.
To continue the simulation from the current time point and retain the set of breakpoints configured in the model, disable all breakpoints.
To open the Breakpoints List, on the Debug tab, click Breakpoints List.
In the Breakpoints List, use the check boxes in the Enable column or the Enable or disable all breakpoints button to disable all the breakpoints.
To resume the simulation, click Continue.
To continue the simulation from the current time point without retaining breakpoints, remove all breakpoints from the model.
To clear all breakpoints in the model, on the Debug tab, click the Add Breakpoint button arrow and select Clear All Breakpoints.
To resume simulation, click Continue.
To stop the simulation at the current time point, in the Simulink Toolstrip, on the Debug tab, click Stop.
See Also
Tools
Blocks
- While Iterator Subsystem | While Iterator | For Iterator Subsystem | For Iterator | For Each Subsystem | For Each