Lookup Table Editor
Description
The Lookup Table Editor tool allows you to create and edit input lookup tables without needing to navigate to the blocks, models, or subsystems that contain them.
Visualize and edit lookup table data in a consistent way similar to a spreadsheet editor, regardless of the data source. A variable data source can be from the MATLAB® base workspace, model workspace, data dictionary, or block dialog box.
Explore lookup tables from multiple models, subsystems, and blocks loaded in the current MATLAB session.
Generate reports containing lookup table data and plots.
For 1-D data, the report generates line plots.
For more than 1-D data, the report generates surface plots, one plot for each 2-D slice of data.
To add custom lookup table blocks to the Lookup Table Editor, see Visualize and Plot N-Dimensional Data Using Mask Lookup Table Control. Block that you mask and configure with this method are accessible in Lookup Table Editor.
This graphic is a view of the Lookup Table Editor for the Throttle
Estimation lookup table block in the Model Fault-Tolerant Fuel Control System example sldemo_fuelsys
model. For this view, the heatmap is enabled and the mesh and contours for the data are
plotted. Observe that the red dots in the plots represent the data in the selected area of the
blue rectangle in the tabular area.

Lookup Table Editor enables you to:
Enter the path to models and subsystems that contain lookup table blocks and the path to lookup table blocks themselves in the lookup table path browser to see them in the list in the Lookup Table Blocks path pane.

In the tabular area, the Lookup Table Editor contains the same lookup table spreadsheet that is available through the
Simulink.LookupTableproperty dialog box. See Edit Lookup Table Data with Lookup Table Spreadsheet.
Generate line, plot, surface, and contour plots for the data.
Enable heatmap overlays for data.

Generate a report of one or more lookup tables in a model.

Register your own lookup table blocks.

Note
Lookup Table Editor provides this option for completeness. For the preferred method, see Visualize and Plot N-Dimensional Data Using Mask Lookup Table Control.
Alternatively, you edit lookup tables from within a lookup table block. For more information, see Enter Breakpoints and Table Data.
Open the Lookup Table Editor
In Simulink® Editor, on the Modeling tab, click Lookup Table Editor. From this interface, you can open the Lookup Table Editor for Simulink, AUTOSAR Blockset, and Simscape™ lookup table blocks. The Lookup Table Editor can also open for empty models. The Lookup Table Editor also recognizes any custom lookup table blocks that you have registered.
From the Simulink blocks 1-D Lookup Table, 2-D Lookup Table, Direct Lookup Table (n-D), n-D Lookup Table, Interpolation Using Prelookup, and Prelookup, click the edit lookup table button.
From the AUTOSAR Blockset blocks Curve (AUTOSAR Blockset), Curve Using Prelookup (AUTOSAR Blockset), Map (AUTOSAR Blockset), and Map Using Prelookup (AUTOSAR Blockset), click the edit lookup table button.
In the MATLAB Command Window, type
lookupTableEditor.In Simulink Editor, click a Simulink or AUTOSAR Blockset lookup table block. In the Lookup Table tab that appears, click Lookup Table Editor.
Create a
Simulink.LookupTableobject and open the property dialog box. The Lookup Table Editor appears at the bottom of the dialog box.
Examples
This example shows how to populate a 2-D
Lookup Table block using the Lookup Table Editor. The lookup table approximates
the function z = x2 +
y2 over the input ranges x = [0,
2] and y = [0, 2].
Add a 2-D Lookup Table block to a model.
Open the Lookup Table Editor. For example, open the block dialog box and click Edit table and breakpoints.
Click in the lookup table path browser. Any models that contain lookup tables appear.
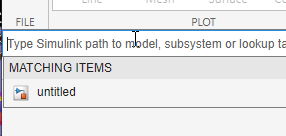
Select untitled and press Enter.
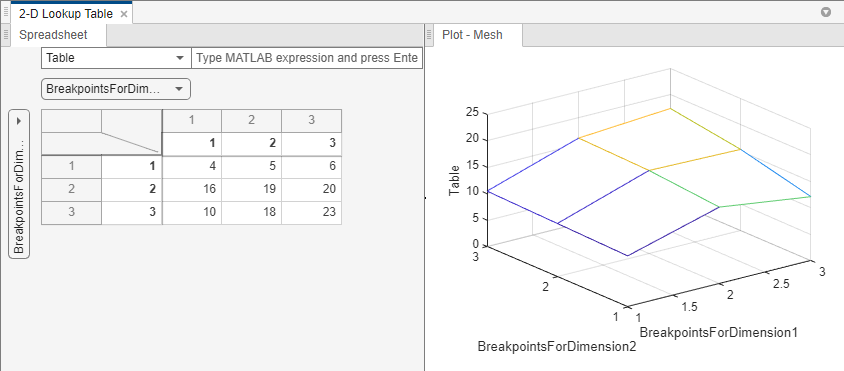
In the hierarchy pane, navigate to the 2-D Lookup Table block.
The lookup table spreadsheet appears on the right.
In the spreadsheet, enter the breakpoint vectors and table data in the appropriate cells. To change data, click a cell, enter the new value, and press Enter.
In the cells associated with the BreakpointsForDimension1, enter each of the values
[0 1 2].In the cells associated with the BreakpointsForDimension2, enter each of the values
[0 1 2].In the table data cells, enter the values in the array
[0 1 4; 1 2 5; 4
                  5 8]
.
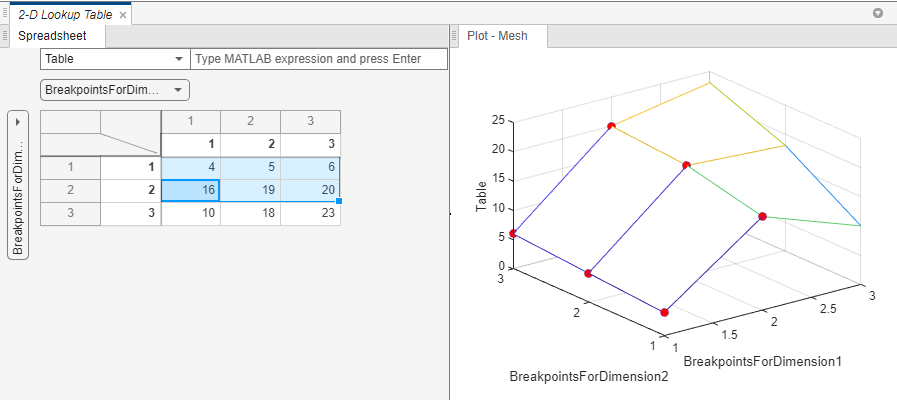
Notice that each value you edit appears as a red dot in the plot to the right. As you click a value in the table, the corresponding plot point is highlighted with a red dot.
![Lookup Table Editor with reflecting data cells [0 1 4; 1 2 5; 4 5 8]](entering_data_in_lut_editor2.png)
In the Lookup Table Editor toolstrip, click Apply to update the data in the 2-D Lookup Table block. If the parameter value in the source is specified as a variable name, the applied data updates the variable data, but does not overwrite the string set in the block dialog box.

This example shows how to use the plots to visualize the data in the Lookup Table Editor.
Add a 2-D Lookup Table block to a model.
Open the Lookup Table Editor. For example, open the block dialog box and click Edit table and breakpoints.
By default, the 2-D Lookup Table block has this data as an example.
To create two tabs, one for the spreadsheet and one for the plot, pause between the spreadsheet and plot and click the red X. To view or tile the panes, drag the panes as you want to position them.
Click the data points in the spreadsheet and observe the corresponding red dot in the plot.
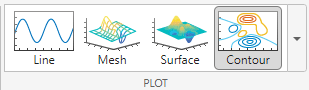
From the toolstrip, click another plot type, such as Line,
Surface, or Contour, and reselect the same
data. These plots are the equivalent of the MATLAB functions line, mesh,
line, surface, and
contour, using the table and breakpoint data.
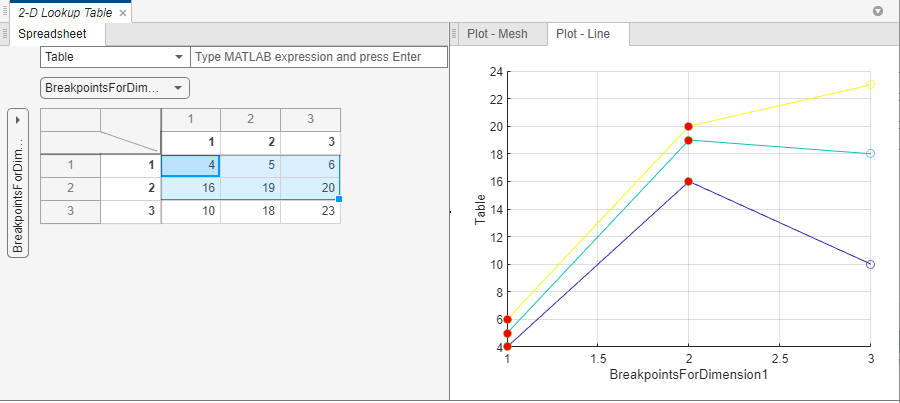
Each plot type and data selection gives you another view of the data on that plot type.
To view heatmaps of your data, click Heatmap in the toolstrip.
This example shows how to copy data from an Excel® spreadsheet or any spreadsheet application into a lookup table.
Add a 2-D Lookup Table block to a model.
Open the Lookup Table Editor. For example, open the block dialog box and click Edit table and breakpoints.
Create or open an existing Excel spreadsheet, for example, an Excel spreadsheet that contains this data.
| -10 | 1 | 25 |
| -7 | 2 | 35 |
| -4 | 4 | 42 |
Copy and paste the contents of the Excel spreadsheet into the lookup table spreadsheet.

Notice that the pasted elements in the lookup table spreadsheet have a yellow border. This yellow border indicates that the data has not yet been saved. To save the data to the data source, click Apply. In this example, the data source is the 2-D Lookup Table block.
At the bottom of the Lookup Table Editor is a table of sources for the data. Use this table of sources to identify which the data source you are editing through Lookup Table Editor.
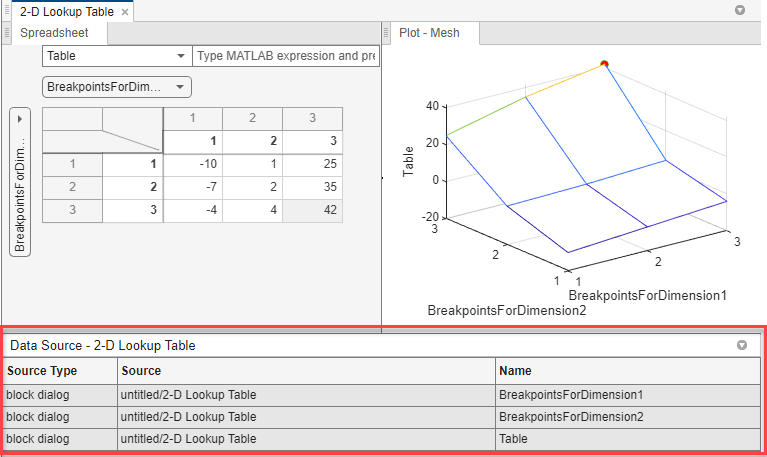
To display and hide this table, click Data Source in the toolstrip.
To get the data from the data source into the Lookup Table Editor, click Reload. If you do not click Apply before clicking Reload, the editor discards the spreadsheet before loading the data from the data source.
To save the data from Lookup Table Editor spreadsheet to the data source, click Apply.
Generate a report of one or more lookup tables in a model. Lookup Table Editor supports report generation only for the n-D Lookup Table, 1-D Lookup Table, n-D Lookup Table, Interpolation Using Prelookup, Prelookup, and Direct Lookup Table blocks. Lookup Table Editor returns a message for blocks for which it does not generate a report.
Open the model sldemo_fuelsys.
openExample('sldemo_fuelsys')Open the Lookup Table Editor. For example, type
lookupTableEditor in the MATLAB Command Window.
In the lookup table path browser, type
openExample('sldemo_fuelsys') and press
Enter.
The sldmeo_fuelsys model and the subsystems that contain lookup
table blocks display in the Lookup Table Blocks pane.
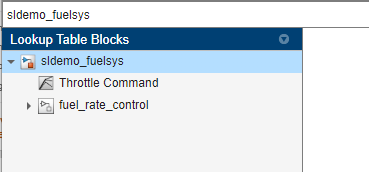
Select fuel_rate_control, then click Generate
Report.
The software evaluates the number of lookup tables in the model (5). Click OK.
The software generates an HTML file, saved to
current_folder/lookupTableReport.html. Each
numbered section of the file contains a report of a lookup table, including information
such as:
Breakpoint data
BP1versusBP2.A plot of the lookup table outputs against the breakpoints
Data types
Notes about the report generation.
Related Examples
Programmatic Use
Limitations
The Lookup Table Editor does not support lookup tables containing data specified as
Simulink.VariantVariable. When you try to open a lookup table that contains this data type, the lookup table block returns an error in a pop-up window.The Lookup Table Editor overwrites expressions set in the block dialog box unless they are non-variable names or pure structure field references. For example, if an expression
myDataSet.MyLookupTable.Breakpointsis set as the parameter value, the Lookup Table Editor updates the value ofmyDataSet.If the Lookup Table Editor has a data source that is specified more than once, for example, if the same model workspace variable myVar is used for both breakpoints and table, the entire lookup table is read-only.
If the lookup table contains data passed in through a model argument, the Lookup Table Editor treats the local model variable as the data source.
The Lookup Table Editor supports report generation only for the n-D Lookup Table, 1-D Lookup Table, 2-D Lookup Table, Interpolation Using Prelookup, Prelookup, and Direct Lookup Table n-D blocks.
The Lookup Table Editor does not support runtime tunability of parameters.
The Lookup Table Editor shows breakpoints for the Interpolation Using Prelookup block only when the Interpolation Using Prelookup block is directly connected to one or more Prelookup blocks. The Lookup Table Editor always reads breakpoint data from a directly connected Prelookup block regardless of whether there is a different breakpoint object being selected with the
Simulink.LookupTableobject in the Interpolation using Prelookup block.
Version History
Introduced in R2022a
See Also
Blocks
- 1-D Lookup Table | 2-D Lookup Table | Direct Lookup Table (n-D) | n-D Lookup Table | Interpolation Using Prelookup | Prelookup
Functions
External Websites
Select a Web Site
Choose a web site to get translated content where available and see local events and offers. Based on your location, we recommend that you select: United States.
You can also select a web site from the following list
Americas
- América Latina (Español)
- Canada (English)
- United States (English)
Europe
- Belgium (English)
- Denmark (English)
- Deutschland (Deutsch)
- España (Español)
- Finland (English)
- France (Français)
- Ireland (English)
- Italia (Italiano)
- Luxembourg (English)
- Netherlands (English)
- Norway (English)
- Österreich (Deutsch)
- Portugal (English)
- Sweden (English)
- Switzerland
- United Kingdom (English)