Evaluate Status of Back-to-Back Testing for Software Units
When you design a software unit, you can test the model against different types of simulations, like normal mode, software-in-the-loop (SIL), and processor-in-the-loop (PIL) simulations. Industry-recognized software development standards, such as ISO 26262, recommend that you compare the results from normal mode simulations with the results from simulations on your generated code. The process of running and comparing these simulation results is called back-to-back testing. Back-to-back testing can help you verify that your model and generated code are functionally equivalent.
You can automatically compare the back-to-back testing results in the SIL Code Testing and PIL Code Testing dashboards. The back-to-back testing metrics return the status for each test by comparing, at each time step, the outputs of the normal mode model simulation and the outputs of the code executed in SIL or PIL mode. By using these metrics, you can make sure that you run the necessary tests to validate your requirements, identify issues, and assess translation validation between your model and generated code.
In this example, you run tests in normal mode and SIL mode, identify and fix issues, and confirm that the two tests are equivalent. This example shows how to assess the status of SIL tests by using the SIL Code Testing dashboard, but you can follow the same steps to analyze PIL tests in the PIL Code Testing dashboard.
For information on test authoring and the different simulation types, see Test Planning and Strategies (Simulink Test) and SIL and PIL Simulations (Embedded Coder).
View Status of Model Testing
The example project cc_CruiseControl contains a software component and several software units. To open the example project, in the MATLAB® Command Window, enter:
openProject("cc_CruiseControl");
scenario = "incomplete"; loadScenario();
To view the current status of the model testing, open the Model Testing Dashboard. On the Project tab, click Model Testing Dashboard. Or, in the Command Window, enter:
modelTestingDashboard
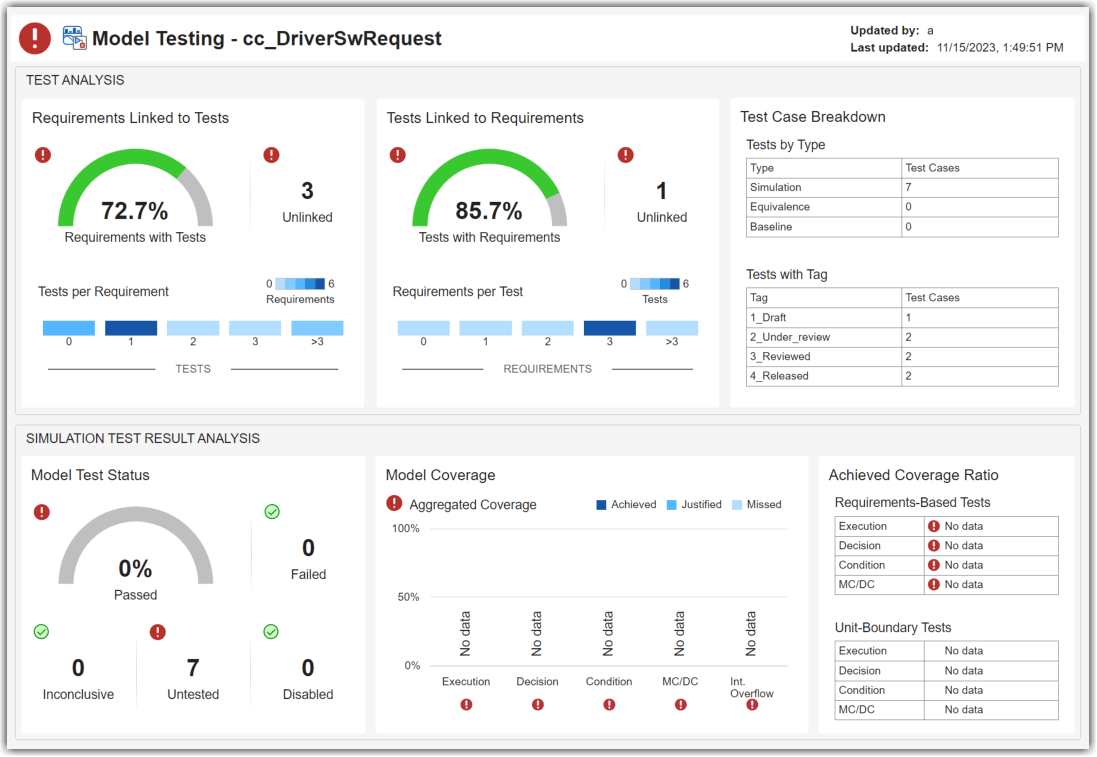
View the model testing metric results for the software unit cc_DriverSwRequest. In the Project panel, click cc_DriverSwRequest.
If you previously collected metric data for a unit, the dashboard populates with the existing data. The dashboard shows the model testing metric results, such as the number of requirements linked to tests, the number of tests linked to requirements, the number of passing model tests, and the status of model testing coverage. Collecting data for a metric requires a license for the product that supports the underlying artifacts, such as Requirements Toolbox™, Simulink® Test™, or Simulink Coverage™. After you collect metric results, you need only a Simulink Check™ license to view the results. For more information, see Model Testing Metrics. For information on how to navigate and use the Model Testing Dashboard, see Explore Status and Quality of Testing Activities Using Model Testing Dashboard.
Identify Unit Tests That Have Not Been Run
Identify which tests have not been run on the unit. In the Model Test Status section, click the Not Run widget.

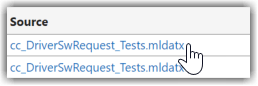
The dashboard opens the Metric Details table, which includes information about the tests that have not run. In the Artifact column are hyperlinks to the tests. The Source column shows the test file that contains the test. You can point to the hyperlinks to view more information about the tests or use the hyperlinks to open the test files in Test Manager.
In this example, the tests that have not run yet are located in the same test file. Open the test file by clicking cc_DriverSwRequest_Tests.mldatx in the Source column.
Run Tests in Normal Mode
You can run the tests to see how the model performs. The tests in this example project are set to run normal mode simulations by default. In the Test Manager toolstrip, click the Run button.
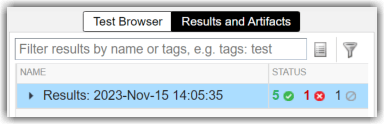
The test results show that five tests pass, one test fails, and one test is disabled.
Typically, you review and fix non-compliant model testing results before you review the code testing results. For this example, do not fix the failing test.
Run Tests in Software-in-the-Loop (SIL) Mode
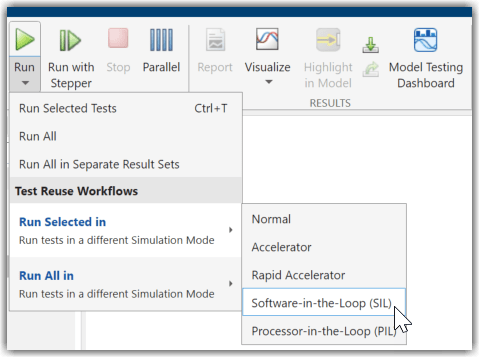
Run the same tests again, but in software-in-the-loop (SIL) mode to see how the generated code performs. In Test Manager, click the Test Browser tab. Then, in the toolstrip, click Run > Run Selected in > Software-in-the-Loop (SIL).
The SIL test results show that five tests pass, one test fails, and one test is disabled.
View Status of Model and Code Testing
You can view a summary of the model and code testing results in the dashboards. Return to the Dashboard window and, in the warning banner, click Collect.
![]()
The dashboard collects the most recent metric results and updates the Metric Details information in the dashboard. There are no tests that have not run yet in the Metric Details table for the software unit cc_DriverSwRequest.
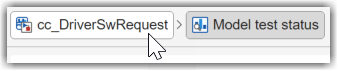
To view the overall status of the model testing results, navigate to the main model testing results using the breadcrumb. Click cc_DriverSwRequest.
Update the impacted model testing metric results for the cc_DriverSwRequest model by clicking Collect in the warning banner.
The Model Test Status section shows that 71.4% of model tests passed.

To view the status of the code testing results, open the SIL Code Testing dashboard. In the dashboard toolstrip, in the Add Dashboard section, click SIL Code Testing.
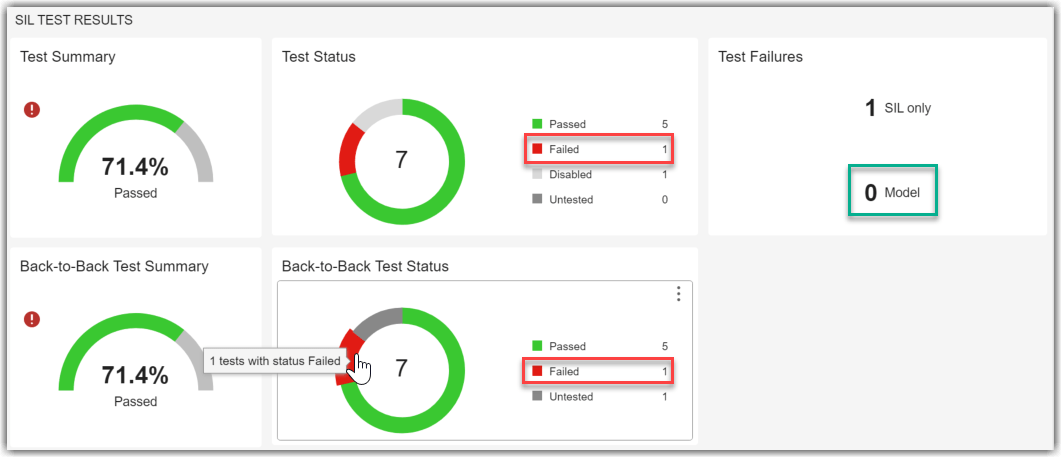
The SIL Test Results section shows that 71.4% of SIL code tests passed, but one test failed during both model testing and SIL code testing. The Back-to-Back Test Status widget shows that you successfully ran each test back-to-back, once in normal mode and once in SIL mode. However, you need to address the failing test results.

Identify and Fix Test Failures
You can investigate the test failures by looking into the results. Under SIL Test Results, in the Test Failures section, click the Model widget.
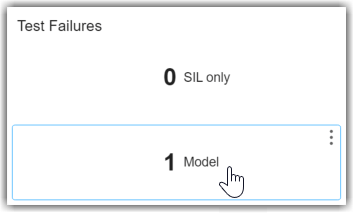
The Metric Details table shows that the test called Detect set failed. To the source of those failing results, in the Artifact column, click the Detect set results.

The failing test result opens in Test Manager. The Logs section in the right pane shows that the actual value returned during the simulation did not match the expected value.

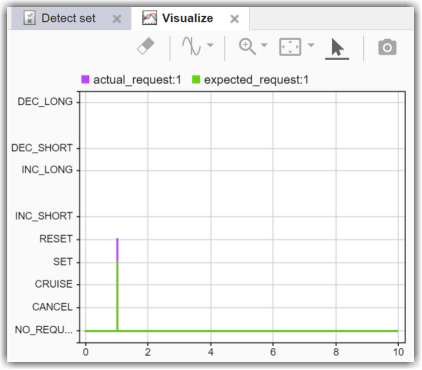
To visualize the difference between the actual and expected values, open the simulation output. In the Results and Artifacts pane, under Detect set, select Sim Output. Then, in the Data Inspector tab, select actual_request and expected_request. Alternatively, you can use the function metric.loadB2BResults.
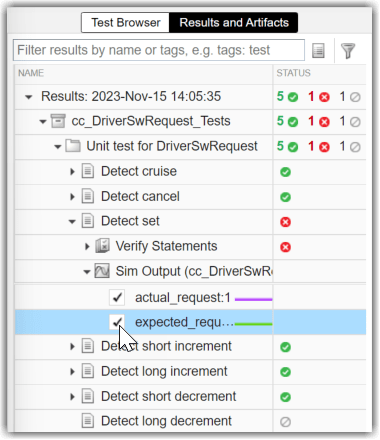
The Data Inspector tab shows the difference between the actual values and expected values. During the test, the software unit cc_DriverSwRequest requested the value RESET instead of SET.
To fix the failure, open the software unit cc_DriverSwRequest. In the dashboard, in the Artifacts panel, double-click cc_DriverSwRequest.
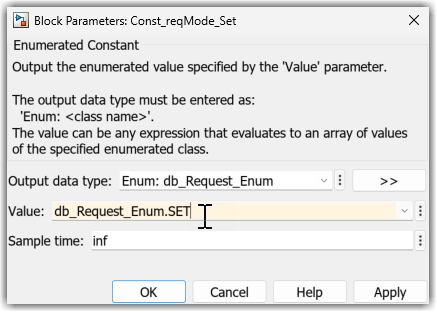
The test fails because the input to the subsystem DetectRaiseAndOverride2 is RESET instead of SET. Double-click the Const_reqMode_Set block with the text db_Request_Enum.RESET on the block icon and change the Value parameter to db_Request_Enum.SET. Save the model.

Re-Run Tests and Confirm Back-to-Back Testing
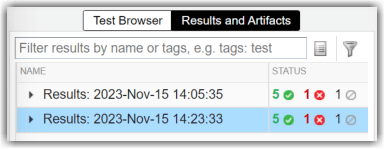
In Test Manager, re-run the test Detect set. In the Test Browser tab, select Detect set. Then, in the toolstrip, click Run. The test passes.
![]()
Check the status of the model and code testing in the SIL Code Testing dashboard. In the dashboard, click Collect to re-collect the metric results.
The SIL Test Results show that there are now zero model test failures, but there is still a SIL test failure, and one test fails back-to-back testing. Because you only re-ran the test Detect set in normal mode, there are no updated SIL test results for the test.
Get the updated test results and complete the back-to-back testing by re-running the test Detect set in SIL mode. In Test Manager, in the Test Browser tab, select Detect set. Then, in the toolstrip, click Run > Run Selected in > Software-in-the-Loop (SIL). The test passes.
![]()
View the latest code testing results to confirm that each of the tests for the software unit passed and ran back-to-back. Return to the SIL Code Testing dashboard.
The dashboard shows zero model failures and indicates that 85.7% of SIL tests passed and 85.7% of the SIL tests ran back-to-back. The remaining test is a disabled test that does not run and therefore has not been tested back-to-back. If you have a disabled test, review whether you need to enable the test to properly test your software unit.

Tolerance Considerations
For baseline tests and simulation tests, the back-to-back metrics use the Simulation Data Inspector to compare the logged outputs from the test and determine the back-to-back testing status. For these tests, the metric specifies the absolute tolerance and relative tolerance values for each signal depending on the data type of the signal. If you need the metric to consider individual signal tolerances in the comparison, use an equivalence test instead.
For more information about the computation details, see:
See Also
Code Testing Metrics | metric.loadB2BResults