Create Layout with Custom Metric
This example shows how to create a custom metric and modify the layout for the Metrics Dashboard to show only information about the model, results from the custom metric, and other custom widgets.
Create Custom Metric
You can define a custom metric by creating a new metric class and specifying what the metric calculates inside the algorithm function of the metric class.
1. Create a new metric class named nonvirtualblockcount.
slmetric.metric.createNewMetricClass('nonvirtualblockcount');The createNewMetricClass function creates a class named nonvirtualblockcount.m in the current working folder.
2. For this example, copy the contents of the example custom metric defined in nonvirtualblockcount_orig.m into the metric class file nonvirtualblockcount.m.
copyfile nonvirtualblockcount_orig.m nonvirtualblockcount.m f
The algorithm function inside the class definition defines what the custom metric calculates. The example file nonvirtualblockcount_orig.m contains an algorithm for a metric that counts the nonvirtual blocks in the current model.
3. Register the custom metric with the model metric repository. The Metrics Dashboard can only use metrics that are available from the model metric repository.
[id_metric,err_msg] = slmetric.metric.registerMetric('nonvirtualblockcount');Note that the custom metric stays in the model metric repository until you unregister the metric by using the slmetric.metric.unregisterMetric function.
Create Layout with Custom Widget
Metrics Dashboard Layout
At a minimum, the Metrics Dashboard requires that a layout contain a 'SystemInfo' widget and at least one widget of type slmetric.dashboard.Widget or slmetric.dashboard.CustomWidget.
The 'SystemInfo' widget is the widget that shows information about the current system, including:
The name of the current system.
The author of the model.
The revision of the current model.
When you collected metric results.
1. Create a new configuration object. The configuration contains the Layout that the Metrics Dashboard uses to arrange the widgets. For this example, specify the Name of the new configuration as "Minimal". For more information on configuration objects, see slmetric.dashboard.Configuration.
dashboardconfig = slmetric.dashboard.Configuration.new(Name='Minimal')dashboardconfig =
Configuration with properties:
Name: 'Minimal'
FileName: ''
Location: ''
2. Get the dashboard layout from the configuration.
layout = getDashboardLayout(dashboardconfig);
3. Use the addWidget function to add a 'SystemInfo' widget to the layout.
addWidget(layout,'SystemInfo')ans =
Widget with properties:
Title: ''
Type: 'SystemInfo'
ID: 'd32c10e1-51fd-490c-ae00-463d043e4f2f'
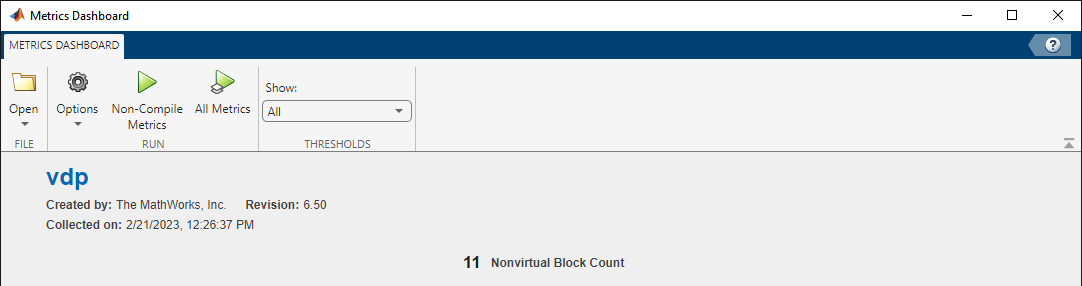
Display Single Value
By default, custom widgets display a single, integer value next to the widget title.
![]()
1. Add a custom widget, customWidget, to the Layout by specifying the widgetType as 'Custom'.
customWidget = addWidget(layout,'Custom');By default, custom widgets specify the VisualizationType 'SingleValue' to display a single, integer value in the dashboard.
2. Assign the custom metric 'nonvirtualblockcount' to the custom widget.
customWidget.setMetricIDs('nonvirtualblockcount');3. Specify a title for the custom widget.
customWidget.Title = 'Nonvirtual Block Count'customWidget =
CustomWidget with properties:
VisualizationType: 'SingleValue'
Labels: {0×1 cell}
Title: 'Nonvirtual Block Count'
Type: 'Custom'
ID: 'cf85635e-a467-4c13-a7e5-6813001e3123'
Use New Layout in Metrics Dashboard
1. Save the updated Configuration, dashboardconfig, as an XML file. The XML file contains the new, minimal layout for the dashboard.
save(dashboardconfig,'Filename','DashboardConfig.xml');
2. Set the XML file as the active configuration for the Metrics Dashboard.
slmetric.dashboard.setActiveConfiguration(fullfile(pwd,'DashboardConfig.xml'));3. Open the Metrics Dashboard for the model vdp.
metricsdashboard vdpWarning: The Metrics Dashboard and slmetric.Engine API will be removed in a future release. For size, architecture, and complexity metrics, use the Model Maintainability Dashboard and metric.Engine API instead. The Model Maintainability Dashboard and metric.Engine API can identify outdated metric results, analyze dependencies between files, and aggregate metrics across software units and components. For more information, see <a href="matlab:helpview([docroot '/slcheck/collect-model-metric-data-1.html'])">Collect Model and Testing Metrics</a>
4. Click All Metrics to run each of the metrics in the dashboard.
The Metrics Dashboard shows only the 'SystemInfo' widget and the custom widget for the custom metric 'nonvirtualblockcount'.
Change How Widgets Display Metric Results
By default, custom widgets use the VisualizationType 'SingleValue'.
When you run the metrics for a 'SingleValue' widget, the widget only displays a single, integer value next to the widget Title.
![]()
However, you can change the visualization type for a custom widget to a bar chart, radial gauge, or distribution heatmap. For more information, see slmetric.dashboard.CustomWidget.
Display Bar Chart
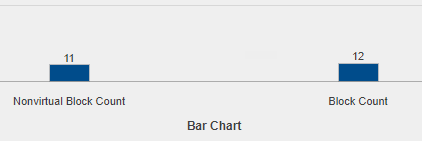
To make a custom widget display metric results in a bar chart:
Specify the
VisualizationTypeas'BarChart'.Use the
Labelsproperty to provide labels for each bar in the bar chart. The label must be specified by a cell array and the number of labels must equal the number of metric IDs associated with the widget.Use the
setHeightfunction to set the height of the widget and make the widget appear in the layout.
Add a new custom widget, barChartWidget, to the Layout.
barChartWidget = addWidget(layout,'Custom'); barChartWidget.VisualizationType = 'BarChart'; barChartWidget.Title = 'Bar Chart'; barChartWidget.setMetricIDs({'nonvirtualblockcount','mathworks.metrics.SimulinkBlockCount'}) barChartWidget.Labels = {'Nonvirtual Block Count','Block Count'}; barChartWidget.setHeight(220);
For this example, the custom widget shows one bar for each metric ID. The bar chart uses the metric IDs for the custom metric 'nonvirtualblockcount' and the Simulink® Check™ metric 'mathworks.metrics.SimulinkBlockCount'. To see a list of the available metrics, use the slmetric.metric.getAvailableMetrics function. For more information, see Model Metrics.
Display Radial Gauge
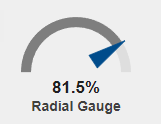
To make a custom widget display metric results in a radial gauge:
Specify the
VisualizationTypeas'RadialGauge'.Provide a metric result value between 0 and 1. The radial gauge supports only values between 0 and 1.
Create a new metric class named randomnumber.
slmetric.metric.createNewMetricClass('randomnumber');For this example, copy the contents of the example custom metric defined in randomnumber_orig.m into the metric class file randomnumber.m.
copyfile randomnumber_orig.m randomnumber.m f
Register the example custom metric. The algorithm function in the custom metric definition specifies a metric value, res.Value, that is a random number between 0 and 1.
slmetric.metric.registerMetric('randomnumber');Add a new custom widget, gaugeWidget, to the Layout.
gaugeWidget = addWidget(layout,'Custom'); gaugeWidget.VisualizationType = 'RadialGauge'; gaugeWidget.Title = 'Radial Gauge'; gaugeWidget.setMetricIDs('randomnumber');
Display Distribution Heatmap
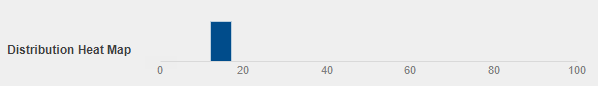
To make a custom widget display metric results in a distribution heatmap:
Specify the
VisualizationTypeas'DistributionHeatmap'.Provide a metric result value as an array of positive, integer values. The distribution heatmap supports only an array of positive, integer values.
Add a new custom widget, heatmapWidget, to the Layout.
heatmapWidget = addWidget(layout,'Custom'); heatmapWidget.VisualizationType = 'DistributionHeatmap'; heatmapWidget.Title = 'Distribution Heat Map'; heatmapWidget.setMetricIDs('mathworks.metrics.SimulinkBlockCount');
For this example, the custom widget displays the metric results for the metric 'mathworks.metrics.SimulinkBlockCount'. The metric 'mathworks.metrics.SimulinkBlockCount' returns the number of blocks in the model and the model subsystems.
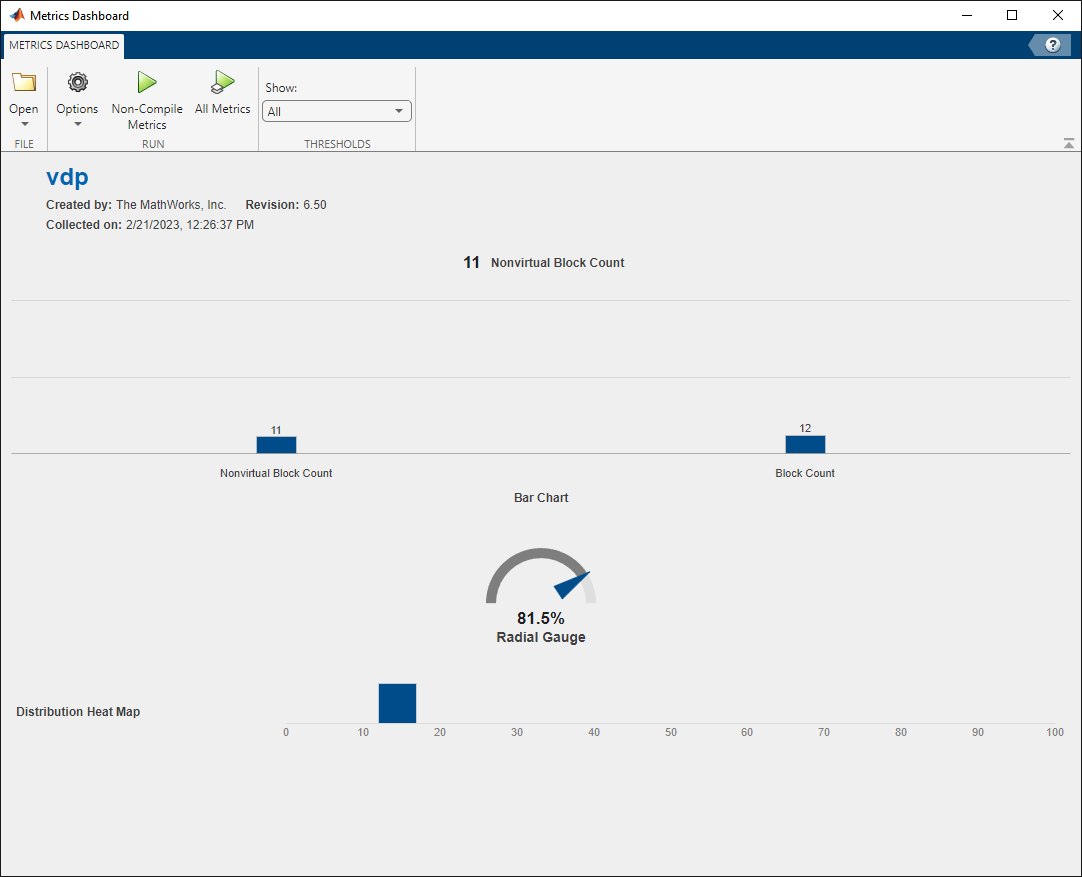
Save Updated Layout and View Metrics Dashboard
To save the updated layout and view the Metrics Dashboard, enter:
save(dashboardconfig,'Filename','DashboardConfig.xml'); slmetric.dashboard.setActiveConfiguration(fullfile(pwd,'DashboardConfig.xml')); metricsdashboard vdp
Warning: The Metrics Dashboard and slmetric.Engine API will be removed in a future release.
For size, architecture, and complexity metrics, use the Model Maintainability Dashboard and metric.Engine API instead.
The Model Maintainability Dashboard and metric.Engine API can identify outdated metric results, analyze dependencies between files, and aggregate metrics across software units and components.
For more information, see <a href="matlab:helpview([docroot '/slcheck/collect-model-metric-data-1.html'])">Collect Model and Testing Metrics</a>
Unregister Custom Metrics
Note that the custom metrics stay in the model metric repository until you unregister the metrics by using the slmetric.metric.unregisterMetric function.
slmetric.metric.unregisterMetric('nonvirtualblockcount');
slmetric.metric.unregisterMetric('randomnumber');
See Also
setMetricIDs | slmetric.dashboard.Configuration | slmetric.dashboard.CustomWidget | slmetric.dashboard.Widget | slmetric.metric.unregisterMetric