Design Finite State Machines in Stateflow
Stateflow® is a graphical programming environment that allows you to create control logic in Simulink® models by defining the operating modes of your system as states in a finite state machine. Additionally, you can:
Reuse and share your logic across models.
Use MATLAB® code or Simulink subsystems as functions in a state machine.
Visualize your logic with live animation.
Debug your logic by using breakpoints and logging simulation data.
Define Logic by Using States and Transitions
Finite state machines model the operating modes of a system as states. A state can modify data, execute code and events, or contain other states.
Finite state machines execute in a series of steps. During each step, each state is either active or inactive. Active states may perform actions or execute code, while inactive states may not. As the conditions in the state machine change, so do the active states.
Consider an automatic transmission in a car. In this animated image, the Stateflow chart models the gears as states. As the speed of the car changes, the transmission shifts gears.

In a state machine, a transition represents the path from one state to another. For example, an automatic transmission system can shift from first gear to second gear, from second gear to first or third gear, and so on.
In the chart above, the Stateflow chart represents the transitions in the transmission system as
arrows between states. Each transition has a condition that determines when the
active state changes. For example, the car shifts from first to second gear when
the speed of the car becomes greater than 10.
Model State Machines by Using State Transition Tables and Charts
With Stateflow, you can model state machines as state transition tables or charts.
Use State Transition Tables
State transition tables represent states and transitions as entries in a table. For example, this state transition table has the same functionality as the automatic transmission chart in the previous section.
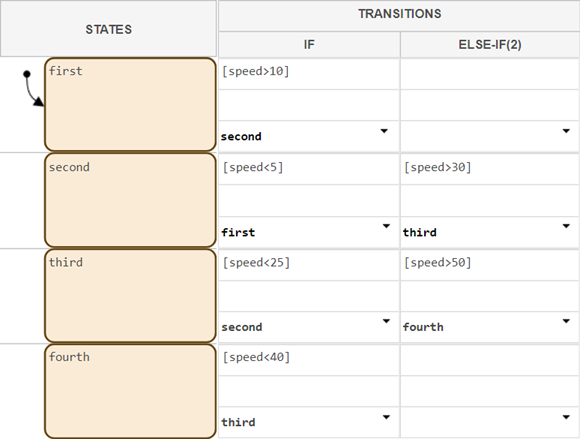
Consider a state transition table if you want to focus on implementing logic without worrying about the graphical layout of your states.
To learn more about creating state transition tables, see Model Bang-Bang Controller by Using a State Transition Table.
Use Charts
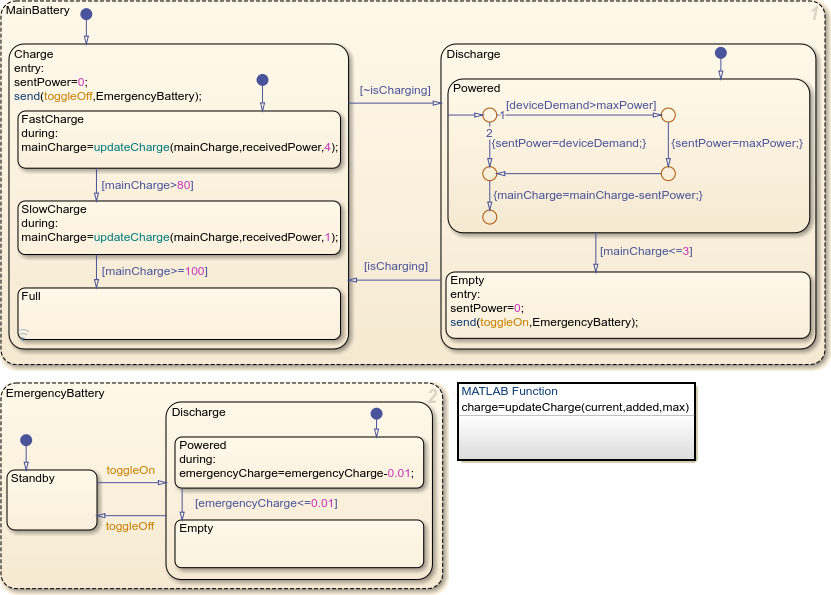
When you create a chart, you model the state machine by arranging graphical objects that represent states and transitions on a canvas. Consider a chart if your logic requires:
Reusable components. For example, you can reuse code in multiple places in one chart, or use the same code in multiple charts.
Event-driven operating modes. For example, you can change states when one component of a chart receives a signal from a different component.
Non-linear flow. For example, you can design an operating flow that uses loops or branching paths.
To learn more about creating Stateflow charts, follow these steps:
In the tutorial, you build a rechargeable battery system. The system has two batteries that contain multiple operating modes, share reusable components, and execute in parallel.