La traduction de cette page n'est pas à jour. Cliquez ici pour voir la dernière version en anglais.
Créer des diagrammes Stateflow
Ce tutoriel utilise un diagramme Stateflow® pour modéliser la logique d’un système de batterie rechargeable.
Le système de batterie obéit aux exigences suivantes :
La batterie se recharge lorsqu’elle est connectée à une source d’énergie externe. Sinon, elle se décharge.
La capacité de la batterie se recharge à un taux de 4 % de la charge totale et se décharge à un taux de 3 %.
Lorsqu’elle se recharge, la batterie ne génère aucune puissance en sortie. Lorsqu’elle se décharge, elle génère une puissance de 3,5 watts.
Pour modéliser ces exigences, vous allez créer un diagramme contenant deux états Charge et Discharge qui représentent les modes de fonctionnement du système de batterie.
Créer un diagramme
Créez un nouveau modèle Simulink® contenant un bloc Chart vide.
Démarrez MATLAB®. Dans la barre d’outils MATLAB, accédez à l’onglet Home et cliquez sur Simulink.
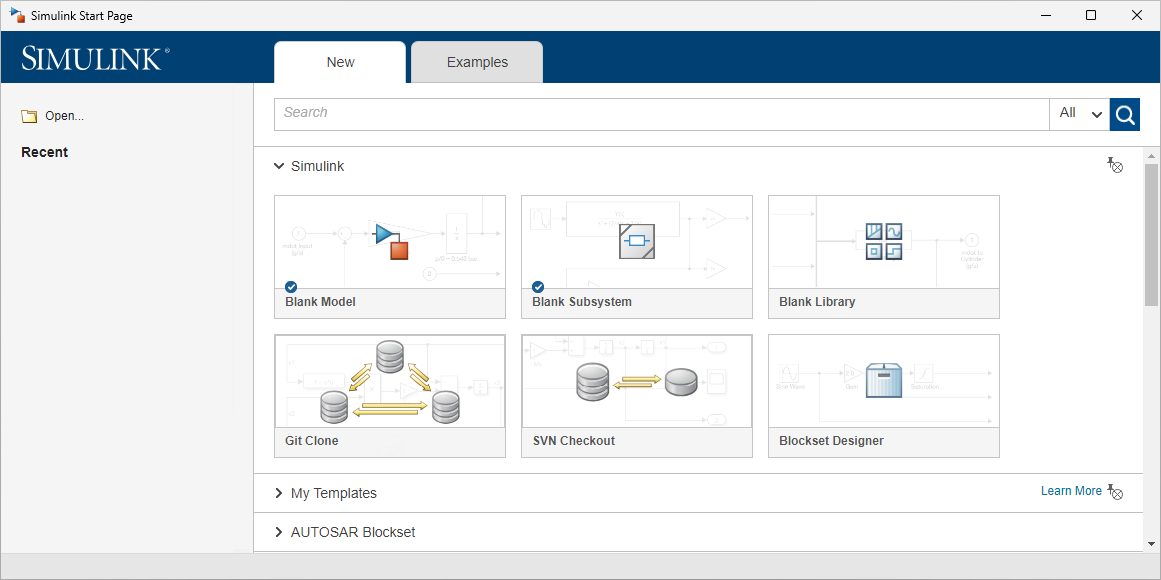
Sur la page de démarrage, accédez à la section Stateflow et cliquez sur le modèle Blank Chart.
L’éditeur Simulink s’ouvre et affiche un modèle contenant un bloc Chart.

Double-cliquez sur le bloc Chart. L’éditeur Stateflow s’ouvre.
L’éditeur Stateflow comprend les composants suivants :
Canevas : environnement graphique dans lequel vous placez des états et des transitions. Le canevas a un arrière-plan de couleur crème par défaut.
Barre de l’explorateur : zone rectangulaire située au-dessus du canevas et affichant le chemin d’accès au diagramme ou à l’élément graphique ouvert. Vous pouvez basculer entre les éditeurs Stateflow et Simulink en cliquant sur les boutons fléchés ou les éléments de modèle.
Palette : menu situé à gauche du canevas à partir duquel vous ajoutez des objets à celui-ci. Il contient des icônes pour les états
 et les autres éléments de diagramme.
Pour afficher les noms des objets, faites un clic droit sur la palette et cliquez sur Show Names. Pour masquer les noms, faites un clic droit et sélectionnez Hide Names.
Volet Symbols : volet situé par défaut à droite du canevas où vous créez et gérez des données, des événements et des messages qui permettent au diagramme de communiquer avec le reste du modèle Simulink.
Pour ouvrir ou fermer le volet Symbols, accédez à l’onglet Modeling et cliquez sur Symbols Pane.

Ajouter des états
Le système de batterie nécessite deux états : un pour la charge et un pour la décharge. Utilisez la palette pour ajouter les deux états au canevas.
Dans la palette, cliquez sur l’icône d’état
. Pour placer l’état, pointez sur une section vide du canevas et cliquez.
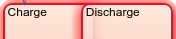
Lorsque vous placez un état, l’éditeur vous invite à saisir un nom d’état dans le coin supérieur gauche de l’état. Saisissez
Charge.Pour finaliser le nom de l’état, cliquez sur une section vide du canevas. Pour modifier un nom d’état existant, cliquez sur le texte à l’intérieur de l’état.
Remarque
Les noms d’états ne peuvent pas contenir d’espace ni commencer par un chiffre. Chaque nom d’état doit être unique.
Ajoutez un deuxième état et nommez-le
Discharge.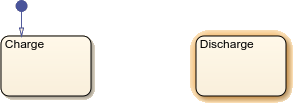
Remarque
Les bords des états ne doivent pas se chevaucher.
Connecter les états
Les transitions déterminent quand et comment votre diagramme passe d’un état à un autre.
Utiliser les transitions par défaut pour indiquer le premier état actif
Un cercle bleu ![]() indique une transition par défaut qui détermine quel état est activé quand la simulation démarre.
indique une transition par défaut qui détermine quel état est activé quand la simulation démarre.
Le diagramme place une transition par défaut sur le premier état ajouté au canevas. Dans cet exemple, la transition par défaut est connectée à l’état Charge. Vous pouvez ajouter d’autres transitions par défaut depuis la palette en cliquant sur l’icône de transition par défaut ![]() puis sur le bord d’un état.
puis sur le bord d’un état.
Comme les exigences stipulent que la batterie doit démarrer en mode charge, vous n’avez pas besoin de déplacer la transition par défaut.
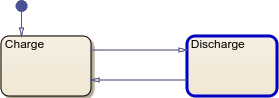
Ajouter des transitions entre les états
Les transitions entre les états permettent au diagramme de passer d’un état à un autre.
Pour créer la première transition, pointez vers le bord de l’état
Chargejusqu’à ce que le curseur devienne un signe plus. Cliquez et faites glisser jusqu’au bord de l’étatDischarge.
Conseil
Pour déplacer une transition existante, cliquez sur la flèche et faites-la glisser.
Créez une transition de
DischargeversCharge.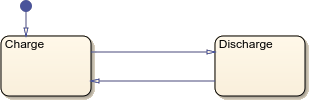
Simulez le modèle. Dans l’onglet Simulation, cliquez sur Run.
Quand un état devient actif, le diagramme met en surbrillance les bords de celui-ci. Quand le diagramme suit une transition, il la met brièvement en surbrillance. Pendant la simulation, le diagramme bascule entre les états
ChargeetDischargeà chaque étape.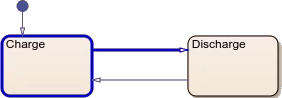
Conseil
Pour modifier la vitesse d’animation, accédez à l’onglet Debug, cliquez sur le menu déroulant Animation Speed et sélectionnez une option.
Ajouter des libellés de transition
Pour modifier le comportement des transitions, vous pouvez ajouter des libellés de transition. Ceux-ci comprennent trois composants facultatifs :
Un déclencheur par événement ou un déclencheur par message qui empêche le diagramme de suivre la transition jusqu’à ce que cette dernière reçoive un événement ou message diffusé à partir d’un autre objet du diagramme ou du modèle.
Une condition à remplir avant que le diagramme puisse suivre la transition. Pour spécifier une condition, utilisez des crochets.
Une action qui s’exécute quand le diagramme suit la transition. Pour spécifier une action, utilisez des accolades.
![]()
Lorsque vous créez une transition pour la première fois, l’éditeur vous invite à saisir un libellé. Vous pouvez également ajouter un libellé de transition en double-cliquant sur la transition.
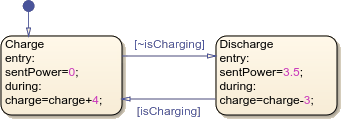
Ajoutez des conditions aux transitions entre les états.
Pour effectuer une transition de
ChargeversDischargeuniquement quand le modèle ne se recharge pas, double-cliquez sur la transition et saisissez le libellé[~isCharging].Pour finaliser le libellé, cliquez sur le canevas. Pour déplacer le libellé, cliquez dessus et faites-le glisser.
Pour effectuer une transition de
DischargeversChargeuniquement quand le modèle se recharge, saisissez le libellé[isCharging].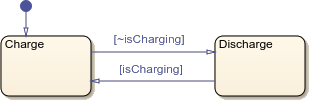
Ajouter du code exécutable
Vous pouvez exécuter du code dans les états actifs en ajoutant des actions d’état dans le libellé de l’état. Les actions d’état contiennent un mot clé suivi d’un signe deux-points et d’un bloc de code exécutable.
Dans cet exemple, vous allez utiliser trois types d’actions d’état.
| Action d’état | Comportement |
|---|---|
entry | S’exécute quand l’état devient actif. |
during | S’exécute à chaque étape où un état est actif. Ne s’exécute pas à l’étape où l’état devient actif ou inactif. |
exit | S’exécute quand l’état devient inactif. |
Ajoutez des actions d’état qui modifient la puissance en sortie et la charge de la batterie selon le mode de fonctionnement.
Dans l’état
Charge, modifiez le libellé en cliquant sur le nom de l’état. Ajoutez une nouvelle ligne puis saisissez le texte ci-dessous. Vous pouvez ajouter de nouvelles lignes en appuyant sur Enter.L’actionentry:sentPower=0;during:charge=charge+4;entrydéfinit une variable nomméesentPowerà0. L’actionduringincrémente une variable nomméechargede4.Conseil
Pour redimensionner manuellement un état, cliquez sur l’un des coins et faites-le glisser. Pour reformater automatiquement tous les objets du canevas, désélectionnez-les en cliquant sur une section vide du canevas. Appuyez ensuite sur Ctrl+Maj+A.

Dans l’état
Discharge, ajoutez une actionentryqui définitsentPowerà3.5et une actionduringqui décrémentechargede3.
Définir les données du diagramme et les partager avec le modèle Simulink
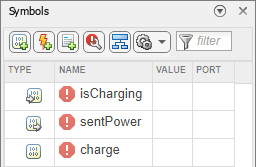
Lorsque vous utilisez une variable dans une transition ou un état, vous devez la définir en tant que donnée d’entrée, donnée de sortie ou donnée locale. Dans le volet Symbols, le badge d’avertissement  indique des données non définies.
| Icône | Type | Comportement |
|---|---|---|
 | Donnée d’entrée | Pendant la simulation, cette donnée reçoit la valeur du signal d’entrée. La définition d’une donnée d’entrée ajoute un port d’entrée au bloc Chart dans Simulink. Il est impossible d’affecter manuellement des valeurs aux données d’entrée. |
 | Donnée de sortie | Pendant la simulation, le diagramme envoie la valeur de cette donnée en sortie à Simulink. La définition d’une donnée de sortie ajoute un port de sortie au bloc Chart dans Simulink. |
 | Donnée locale | Pendant la simulation, cette donnée stocke les informations qui ne sont accessibles que dans le diagramme. |
Le diagramme déduit le type de chaque donnée en fonction du contexte. Par exemple, il déduit que isCharging est une donnée d’entrée, sentPower est une donnée de sortie et charge est une donnée locale.
Définissez le type et la valeur des données du diagramme.
Pour accepter les types de données obtenus par déduction, accédez au volet Symbols et cliquez sur le bouton « Resolve undefined symbols »
 . Les badges d’avertissement en regard des données non définies disparaissent.
Définissez la charge initiale de la batterie. Dans le volet Symbols, dans la ligne
charge, cliquez sur la colonne Value et saisissez50.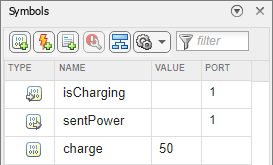
Remarque
Pendant la simulation, les données ayant une valeur non définie sont définies par défaut à
0.Pour revenir au plus haut niveau du modèle Simulink, dans la barre de l’explorateur, cliquez sur le bouton « Up to Parent »
 .
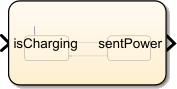
.Le bloc Chart dispose d’un port d’entrée et d’un port de sortie. Pour voir les noms des ports, développez le bloc Chart en cliquant sur un coin et en le faisant glisser vers l’extérieur.
Connecter des blocs Simulink au diagramme
Pour terminer le modèle, connectez les blocs Source et Sink aux ports d’entrée et de sortie du bloc Chart.
Pour représenter le système de batterie qui se connecte à une source d’énergie externe ou s’en déconnecte, ajoutez un bloc Manual Switch au canevas Simulink. Connectez la sortie à l’entrée du bloc Chart.
Ajoutez un bloc Constant de valeur
1. Connectez la sortie au premier port d’entrée du bloc Manual Switch.Ajoutez un bloc Constant de valeur
0. Connectez la sortie au deuxième port d’entrée du bloc Manual Switch.Ajoutez un bloc Scope. Connectez le port de sortie du bloc Chart au port d’entrée du bloc Scope.
Nommez le bloc Chart
Battery.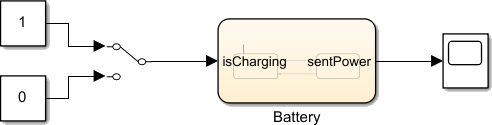
Simuler le modèle
Simulez le modèle terminé.
Dans l’onglet Simulation, définissez Stop Time à
Inf.Double-cliquez pour accéder au bloc Chart.
Pour simuler le modèle, accédez à l’onglet Modeling et cliquez sur Run. Remarquez que les bords de l’état
Chargesont mis en surbrillance en bleu.Revenez dans l’éditeur Simulink.
Pour faire basculer le bloc Manual Switch, double-cliquez dessus.
Ouvrez l’éditeur Stateflow. Remarquez que les bords de l’état
Dischargesont mis en surbrillance en bleu.Pour terminer la simulation, accédez à l’onglet Modeling et cliquez sur Stop.
Basculez le bloc Manual Switch sur
1.
Dans l’étape suivante du tutoriel, vous utiliserez la sortie de l’état actif, l’enregistrement et les points d’arrêt pour vérifier et débugger le modèle de batterie.