fsurfht
R2026bInteractive contour plot of function
Description
fsurfht(
allows you to specify five optional parameters for the function
fun,Xlims,Ylims,p1,p2,...,p5)fun.
fsurfht with no input arguments creates an interactive contour plot
of the peaks function.
Examples
Create an interactive contour plot for the power function f(,) = . Specify the plot ranges [0.1 1] for x and [1 10] for y.
fsurfht("power",[0.1 1],[1 10])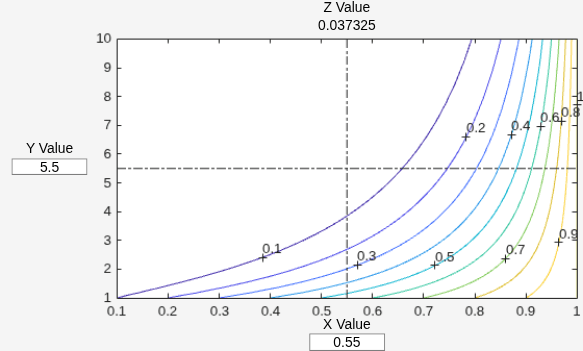
The Z Value box contains the value of the power function at the intersection of the dot-dashed crosshair lines at the center of the plot. Click the plot or enter values in the X Value and Y Value boxes to display the function value at a different location.
Define a function named mytrigfun.m that returns a linear combination of two trigonometric functions.
Display the contents of the mytrigfun.m file.
type mytrigfun.mfunction z = mytrigfun(X,Y,a,b,type)
if type == "cos"
z = a*cos(X)+b*cos(Y);
else
z = a*sin(X)+b*sin(Y);
end
end
Create a contour plot of the function over the range –pi to pi for X and Y. Specify a = 2 and b = –3, and use a linear combination of sine functions.
fsurfht("mytrigfun",[-pi pi],[-pi pi],2,-3,"sin")
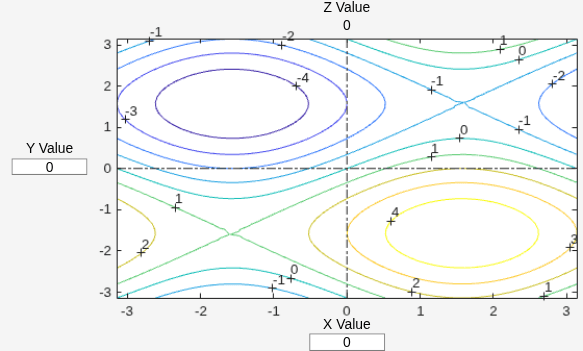
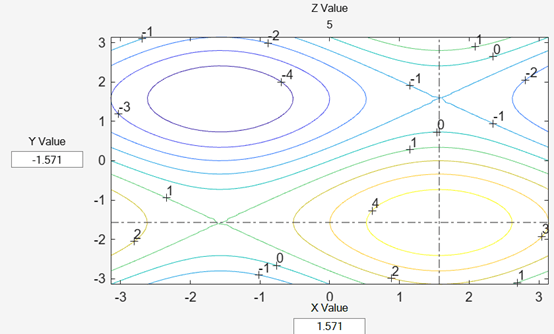
Evaluate z at the maximum by entering the values in the X Value and Y Value boxes shown below.
Input Arguments
Alternative Functionality
You can also create a contour plot using the contour function, which offers greater functionality than
fsurfht. For an example, see Contours of a Function. When you create a contour plot using contour, you can display
information about the contour line values by setting datacursormode to "on" at the command line and then clicking
a contour line in the plot.

