incrementalDynamicKMeans
Description
The incrementalDynamicKMeans function creates an
incrementalDynamicKMeans model object that is suitable for incremental dynamic
k-means clustering. incrementalDynamicKMeans allows you to update
the dynamic clustering model incrementally by supplying chunks of data to the incremental
fit function. To
perform incremental k-means clustering with a fixed number of clusters, use
incrementalKMeans.
When you call the incrementalDynamicKMeans function, you can specify clustering
options, such as the cluster growth penalty factor, the warm-up period, and whether to
standardize the training data before fitting the model to data. After you create an
incrementalDynamicKMeans object, it is prepared for incremental dynamic
k-means clustering. For more information, see Incremental Dynamic k-Means Clustering.
Creation
You can create an incrementalDynamicKMeans model object in two ways:
Call the function directly — Configure incremental dynamic k-means clustering options by calling
incrementalDynamicKMeansdirectly. This approach is best when you do not have data yet or you want to start incremental dynamic k-means clustering immediately. When you callincrementalDynamicKMeans, you can specify initial cluster centroids and cluster counts so that the initial model is warm.Call an incremental learning function — The
fitandupdateMetricsfunctions accept a configuredincrementalDynamicKMeansmodel object and data as input, and return anincrementalDynamicKMeansmodel object updated with information computed from the input model and data.
Syntax
Description
Mdl = incrementalDynamicKMeans(numClusters=k)
Mdl = incrementalDynamicKMeans(centroids=C)C.
Mdl = incrementalDynamicKMeans(___,Name=Value)Mdl=incrementalDynamicKMeans(numClusters=12,Distance="cityblock")
creates an incrementalDynamicKMeans model object that has 12 initial
clusters and uses the city block distance metric.
Input Arguments
Name-Value Arguments
Properties
Object Functions
fit | Train model for incremental dynamic k-means clustering |
updateMetrics | Update performance metrics in incremental dynamic k-means clustering model given new data |
assignClusters | Assign observations to existing clusters and dynamic clusters |
reset | Reset incremental dynamic k-means clustering model |
Examples
Create a training data set of 10,000 observations of three predictors. The data set contains ten groups of 1000 observations each. The predictor values of each group centroid lie within the range ([–10,10], [–10,10], [–10,10]). Store the group identification numbers in ids.
rng(0,"twister"); % For reproducibility
ngroups = 10;
obspergroup = 1000;
Xtrain = [];
ids = [];
cposrange = 10;
for c = 1:ngroups
    sigma = rand;
    Xtrain = [Xtrain; randn(obspergroup,3)*sigma + ...
        (randi(2*cposrange,[1,3])-cposrange).*ones(obspergroup,3)];
    ids = [ids; c*ones(obspergroup,1)];
end
Shuffle the data set.
ntrain = size(Xtrain,1);
indices = randperm(ntrain);
Xtrain = Xtrain(indices,:);
ids = ids(indices,:);
Split off the last 2000 observations to create a test set.
Xtest = Xtrain(end-1999:end,:);
idsTest = ids(end-1999:end,:);
Xtrain = Xtrain(1:end-2000,:);
ids = ids(1:end-2000,:);
Plot the data set and color the observations according to their group number.
scatter3(Xtrain(:,1),Xtrain(:,2),Xtrain(:,3),1,ids,"filled");
colormap(jet);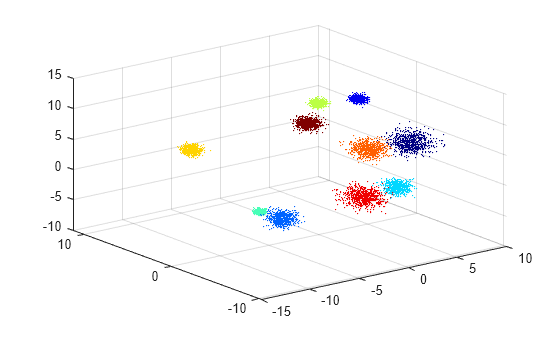
Create Incremental Model
Create an incremental dynamic k-means model object with numClusters=2 and default parameters.
Mdl = incrementalDynamicKMeans(numClusters=2);
Display the initial number of clusters and dynamic clusters.
Mdl.NumClusters
ans =
11
Mdl.NumDynamicClusters
ans =
11
The software sets Mdl.NumClusters using the specified value of NumClusters and the default value of NumAdditionalClusters (10). Because the default value of MergeClusters is false, the cluster and dynamic cluster property values of Mdl are identical.
Fit Incremental Clustering Model
Fit the incremental dynamic clustering model to the data using the fit function. To simulate a data stream, fit the model in chunks of 50 observations at a time. Because default value of WarmupPeriod is 1000, updateMetrics only updates performance metrics after the 20th iteration. At each iteration:
Process 50 observations.
Store the number of clusters in
numClustersto see how it evolves during incremental learning.Overwrite the previous incremental model with a new one fitted to the incoming observations.
Update the window and cumulative simplified silhouette performance metrics using the
updateMetricsfunction.Store the metrics for the merged clusters in
silto see how they evolve during incremental learning.
numObsPerChunk = 50;
n = size(Xtrain,1);
nchunk = floor(n/numObsPerChunk);
sil = array2table(zeros(nchunk,2),'VariableNames',["Cumulative" "Window"]);
numClusters = zeros(nchunk);
for j = 1:nchunk
    numClusters(j) = Mdl.NumClusters;
    ibegin = min(n,numObsPerChunk*(j-1) + 1);
    iend   = min(n,numObsPerChunk*j);
    chunkrows = ibegin:iend;
    Mdl = fit(Mdl,Xtrain(chunkrows,:));
    Mdl = updateMetrics(Mdl,Xtrain(chunkrows,:));
    sil{j,:} = Mdl.Metrics{'SimplifiedSilhouette',:};
end
Analyze Incremental Model During Training
Plot the number of clusters at the start of each iteration.
plot(numClusters)
xlabel("Iteration")
ylabel("Number of Clusters")
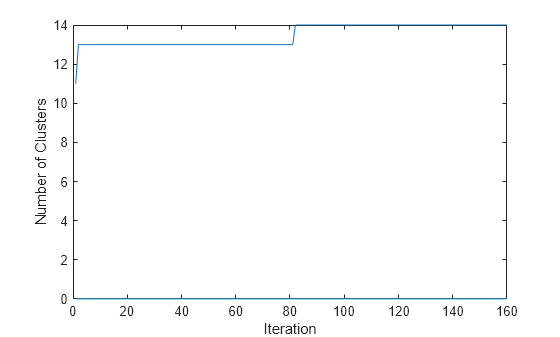
The model initially has 11 clusters, and has 14 clusters at the final iteration.
figure;
plot(sil.Variables);
xlim([0 nchunk])
ylabel("Simplified Silhouette")
xline(Mdl.WarmupPeriod/numObsPerChunk,"g-.")
legend(sil.Properties.VariableNames,Location="southeast")
xlabel("Iteration")
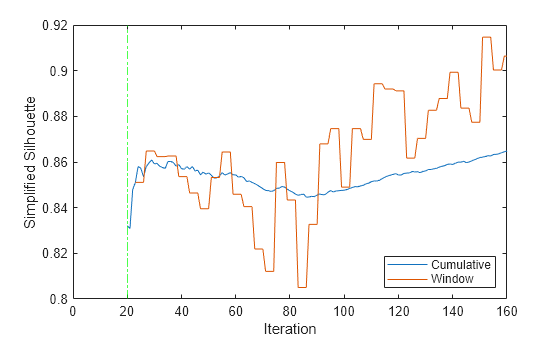
The plot indicates that when the model becomes warm, the window performance metric value is 0.83. After the 90th iteration, the metric value steadily increases.
Create a bar chart of the cluster counts after the final iteration.
bar(Mdl.ClusterCounts)
xlabel("Cluster")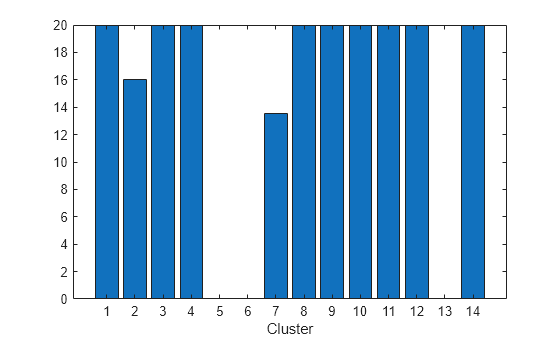
The plot shows that the observations are distributed relatively equally among all clusters except clusters 2, 5, 6, 7, and 13.
Plot the test data set and color the points according to the cluster assignments of the final trained model. Plot the fitted cluster centroids using blue pentagram markers.
idx = assignClusters(Mdl,Xtest);
scatter3(Xtest(:,1),Xtest(:,2),Xtest(:,3),5,idx,"filled");
colormap(jet)
hold on
C = Mdl.Centroids;
scatter3(C(:,1),C(:,2),C(:,3),100,"b","Pentagram","filled");
hold off
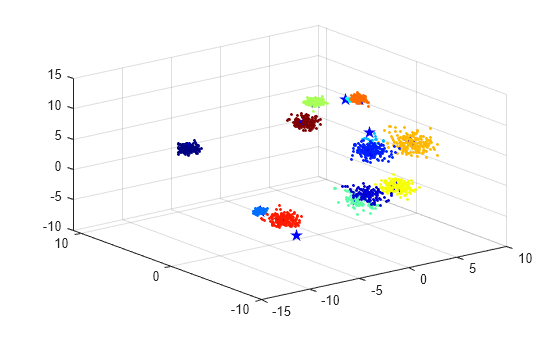
The plot shows that some groups in the test set are fit by a single cluster, while others are fit by two clusters.
Create a data set with 20,000 observations of three predictors. The data set contains two groups of 10,000 observations each. Store the group identification numbers in ids.
rng(0,"twister"); % For reproducibility
ngroups = 2;
obspergroup = 10000;
Xtrain = [];
ids = [];
sigma = 0.4;
for c = 1:ngroups
    Xtrain = [Xtrain; randn(obspergroup,3)*sigma + ...
        (randi(2,[1,3])-1).*ones(obspergroup,3)];
    ids = [ids; c*ones(obspergroup,1)];
end
Shuffle the data set.
ntrain = size(Xtrain,1);
indices = randperm(ntrain);
Xtrain = Xtrain(indices,:);
ids = ids(indices,:);
Create a test set that contains the last 2000 observations of the data set. Store the group identification numbers for the test set in idsTest. Keep the first 18,000 observations as the training set.
Xtest = Xtrain(end-1999:end,:);
idsTest = ids(end-1999:end,:);
Xtrain = Xtrain(1:end-2000,:);
ids = ids(1:end-2000,:);
Plot the training set, and color the observations according to their group identification number.
scatter3(Xtrain(:,1),Xtrain(:,2),Xtrain(:,3),1,ids,"filled");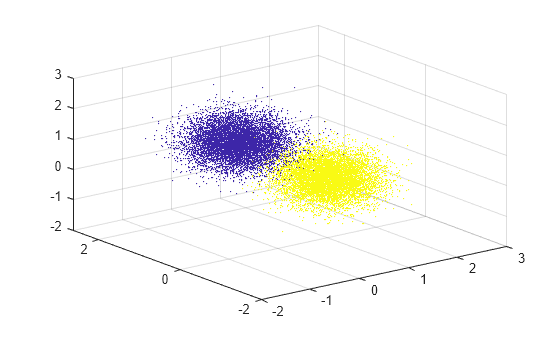
Create Incremental Model
Create an incremental dynamic k-means model object with a warm-up period of 1000 observations. Specify that the incremental fit function stores two clusters that are merged from the dynamic clusters.
Mdl = incrementalDynamicKMeans(numClusters=2, ...
    WarmupPeriod=1000, MergeClusters=true)
Mdl =
incrementalDynamicKMeans
IsWarm: 0
Metrics: [1×2 table]
NumClusters: 2
NumDynamicClusters: 11
Centroids: [2×0 double]
DynamicCentroids: [11×0 double]
Distance: "sqeuclidean"
Properties, Methods
Mdl is an incrementalDynamicKMeans model object that is prepared for incremental learning.
Fit Incremental Clustering Model
Fit the incremental clustering model Mdl to the data using the fit function. To simulate a data stream, fit the model in chunks of 100 observations at a time. Because WarmupPeriod = 1000, fit only returns cluster indices after the tenth iteration. At each iteration:
Process 100 observations.
Store the number of dynamic clusters in
numDynClusters, to see how it evolves during incremental learning.Overwrite the previous incremental model with a new one fitted to the incoming observations.
Update the simplified silhouette performance metrics (
CumulativeandWindow) using theupdateMetricsfunction.Store the metrics for the merged clusters in
siland the metrics for the dynamic clusters indynsil, to see how they evolve during incremental learning.
numObsPerChunk = 100;
n = size(Xtrain,1);
nchunk = floor(n/numObsPerChunk);
sil = array2table(zeros(nchunk,2),"VariableNames",["Cumulative" "Window"]);
dynsil = array2table(zeros(nchunk,2),"VariableNames",["Cumulative" "Window"]);
numDynClusters = [];
for j = 1:nchunk
    numDynClusters(j) = Mdl.NumDynamicClusters;
    ibegin = min(n,numObsPerChunk*(j-1) + 1);
    iend   = min(n,numObsPerChunk*j);
    chunkrows = ibegin:iend;
    Mdl = fit(Mdl,Xtrain(chunkrows,:));
    Mdl = updateMetrics(Mdl,Xtrain(chunkrows,:));
    sil{j,:} = Mdl.Metrics{"SimplifiedSilhouette",:};
    dynsil{j,:} = Mdl.DynamicMetrics{"SimplifiedSilhouette",:};
end
Analyze Incremental Model During Training
Plot the number of dynamic clusters at the start of each iteration.
plot(numDynClusters)
xlabel("Iteration");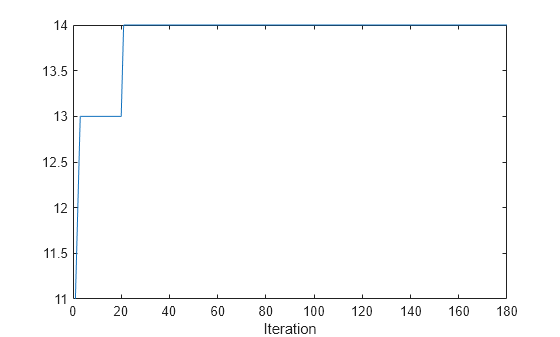
The model initially has 11 dynamic clusters, and 14 dynamic clusters at the final iteration.
Plot the mean simplified silhouette metric for the merged clusters and the dynamic clusters.
figure;
t = tiledlayout(2,1);
nexttile
h = plot(sil.Variables);
ylabel("Simplified Silhouette")
xline(Mdl.WarmupPeriod/numObsPerChunk,"b:")
legend(h,sil.Properties.VariableNames,Location="southeast")
title("Merged Cluster Metrics")
nexttile
h2 = plot(dynsil.Variables);
ylabel("Simplified Silhouette")
xline(Mdl.WarmupPeriod/numObsPerChunk,"b:")
legend(h2,dynsil.Properties.VariableNames,Location="northeast")
xlabel(t,"Iteration")
title("Dynamic Cluster Metrics")
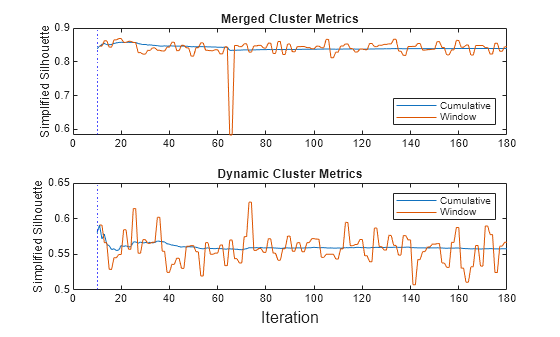
After the warm-up period, the updateMetrics function returns performance metrics. A high metric value indicates that, on average, each observation is well matched to its own cluster and poorly matched to other clusters. The higher metric values in the top plot indicate that the merged clusters provide a better clustering solution for the data than the unmerged dynamic clusters.
Analyze the Final Clustering Model Using the Test Set
Create a bar chart of the dynamic cluster counts after the final iteration.
figure
bar(Mdl.DynamicClusterCounts)
xlabel("Dynamic Cluster Number");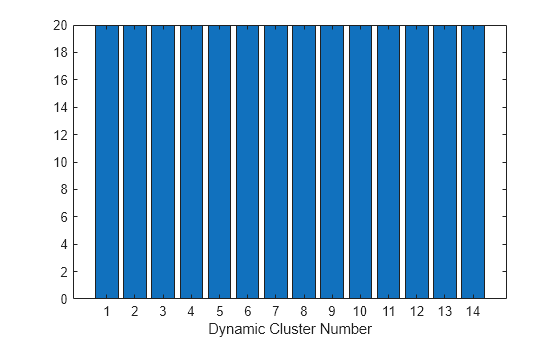
The bar chart shows that the model assigns the observations equally among the dynamic clusters.
Plot the test data set, and color the points according to the dynamic cluster assignments of the final trained model. Plot the dynamic cluster centroids using blue pentagram markers.
C = Mdl.DynamicCentroids;
[~,~,dynIdx] = assignClusters(Mdl,Xtest);
figure;
scatter3(Xtest(:,1),Xtest(:,2),Xtest(:,3),3,dynIdx,"filled");
hold on
scatter3(C(:,1),C(:,2),C(:,3),100,"b","Pentagram","filled");
hold off
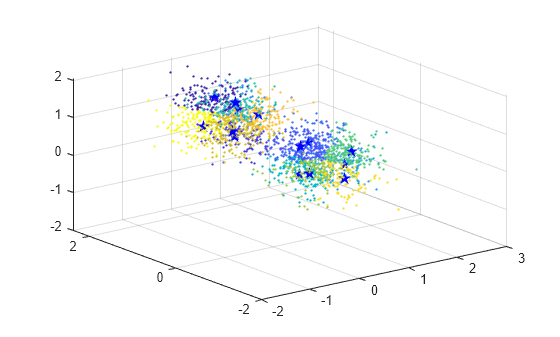
The dynamic cluster centroids are located within the overall distribution of the observations, and are equally divided among the two groups in the data.
Plot the test data set and color the points according to the merged cluster assignments of the final trained model. Use the color red for the observations whose merged cluster assignments do not match the group identification numbers. Plot the merged cluster centroids using blue pentagram markers.
C = Mdl.Centroids;
idx = assignClusters(Mdl,Xtest);
incorrectIds = find(idx ~= idsTest);
figure;
scatter3(Xtest(:,1),Xtest(:,2),Xtest(:,3),1,idx,"filled");
hold on
scatter3(C(:,1),C(:,2),C(:,3),100,"b","Pentagram","filled");
scatter3(Xtest(incorrectIds,1),Xtest(incorrectIds,2),Xtest(incorrectIds,3),5,"r","filled")
hold off
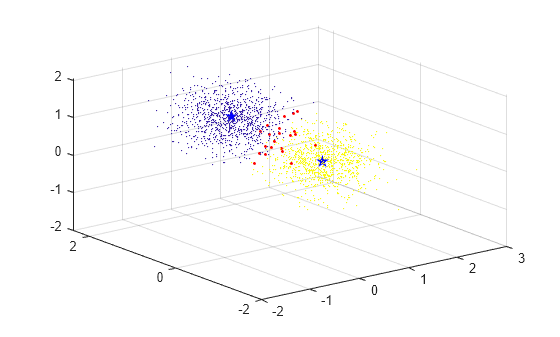
The plot shows that the merged centroids lie near the center of each group in the data. The observations with incorrect cluster assignments lie mainly in the region in between the two groups.
Use the helper function AdjustedRandIndex to calculate the adjusted Rand index, which measures the similarity of the clustering indices and the group identification numbers.
AdjustedRandIndex(idx,idsTest)
ans =
0.9584
The adjusted Rand index is close to 1, indicating that the clustering model does a good job of correctly predicting the group identification numbers of the test set observations.
function ARI = AdjustedRandIndex(labels1, labels2)
% Helper function to calculate the Adjusted Rand Index (ARI) to
% measure the similarity between two clustering labels labels1
% and labels2.

C = confusionmat(labels1, labels2);
n = numel(labels2);

% Calculate sums for rows and columns
sumRows = sum(C, 2);
sumCols = sum(C, 1);

ss = sum(C.^2,"all");

TN = ss-n;                 % True negatives
FP = sum(C*sumCols')-ss;   % False positives
FN = sum(C'*sumRows)-ss;   % False negatives
TP = n^2-FP-FN-ss;         % True positives

if FN == 0 && FP == 0
    ARI = 1;
else
    ARI = 2*(TP*TN-FN*FP)/((TP+FN)*(FN+TN)+(TP+FP)*(FP+TN));
end

end

% LocalWords:  ARI
Prepare an incremental dynamic k-means model by specifying two initial clusters and enable the merging of dynamic clusters. The software uses the specified value of NumAdditionalClusters to set an initial number of dynamic clusters. Specify a growth penalty factor of 500, which imposes a higher cost when the incremental fit function adds more dynamic clusters. Also specify a warm-up period of 100 observations.
Mdl = incrementalDynamicKMeans(numClusters=2,MergeClusters=true, ...
    NumAdditionalClusters=1,GrowthPenaltyFactor=500,WarmupPeriod=100)
Mdl =
incrementalDynamicKMeans
IsWarm: 0
Metrics: [1×2 table]
NumClusters: 2
NumDynamicClusters: 2
Centroids: [2×0 double]
DynamicCentroids: [2×0 double]
Distance: "sqeuclidean"
Mdl is an incrementalDynamicKMeans model object that is configured for incremental learning. The model initially has two dynamic clusters, and two clusters that are merged from the dynamic clusters.
Load and Sort Data
Load the humanactivity.mat file.
load humanactivity.matThis data set contains 20,000 observations of five physical human activities: Sitting (1), Standing (2), Walking (3), Running (4), and Dancing (5). Each observation has 60 features extracted from acceleration data measured by smartphone accelerometer sensors.
Sort the data set so that the first 5000 observations contain only activity modes 1 and 2, the next 5000 observations contain activity modes 1, 2, and 3, and so on.
rng(0,"twister"); % For reproducibility
selectID12 = find(actid == 1 | actid == 2);
selectID123 = find(actid == 1 | actid == 2 | actid == 3);
selectID1234 = find(actid == 1 | actid == 2 | actid == 3 | actid == 4);
batch2 = selectID12(randperm(length(selectID12),5000));
batch3 = selectID123(randperm(length(selectID123),5000));
batch4 = selectID1234(randperm(length(selectID1234),5000));
batch5 = randperm(length(actid),5000)';
feat = [feat(batch2,:); feat(batch3,:); feat(batch4,:); feat(batch5,:)];
actid = [actid(batch2); actid(batch3); actid(batch4); actid(batch5)];
Fit Incremental Clustering Model
Fit the incremental clustering model Mdl to the data by using the fit function. To simulate a data stream, fit the model in chunks of 100 observations at a time. Because WarmupPeriod = 100, fit only returns cluster indices after the first iteration. At each iteration:
Process 100 observations.
Overwrite the previous incremental model with a new one fitted to the incoming observations.
Return the dynamic cluster indices for the data chunk.
Store
actIDcounts, a matrix that contains the number of observations of each activity mode (columns) assigned to each dynamic cluster (rows), to see how it evolves during incremental learning.Store the simplified silhouette performance metrics (
CumulativeandWindow) insilDynamic, to see how they evolve during incremental learning.
n = numel(feat(:,1));
numObsPerChunk = 100;
nchunk = floor(n/numObsPerChunk);
numIDs = numel(unique(actid));   % Number of unique activity modes
actIDcounts = zeros(10,numIDs,nchunk);
silDynamic = array2table(zeros(nchunk,2), ...
    VariableNames=["Cumulative" "Window"]);

% Incremental fitting
for j = 1:nchunk
    ibegin = min(n,numObsPerChunk*(j-1) + 1);
    iend = min(n,numObsPerChunk*j);
    chunkrows = ibegin:iend;
    [Mdl,~,dynamicIndices] = fit(Mdl,feat(chunkrows,:));
    ids = [dynamicIndices,actid(chunkrows)];
    Mdl = updateMetrics(Mdl,feat(chunkrows,:));
    silDynamic{j,:} = Mdl.DynamicMetrics{'SimplifiedSilhouette',:};
    for k = 1:Mdl.NumDynamicClusters
        for i = 1:numIDs
             actIDcounts(k,i,j) = sum(ids(:,1)==k & ids(:,2)==i);
        end
    end
end
Display the number of merged clusters and dynamic clusters in the model after the final iteration.
Mdl.NumClusters
ans =
2
Mdl.NumDynamicClusters
ans =
5
The final model contains 2 merged clusters and 5 dynamic clusters.
For each dynamic cluster, plot the number of observations belonging to each of the five activity modes to see how they evolve during incremental learning.
figure
t = tiledlayout(Mdl.NumDynamicClusters,1,TileSpacing="none");
for c = 1:Mdl.NumDynamicClusters
    nexttile
    plot(squeeze(actIDcounts(c,:,:))')
    xticks(10:10:190);
    yticks([15 30 45]);
    xline(5001/numObsPerChunk,"b:")
    xline(10001/numObsPerChunk,"b:")
    xline(15001/numObsPerChunk,"b:")
    yLimits = ylim;
    ylabel("N_{obs}");
    text(155,yLimits(2)-0.2*diff(yLimits), ...
        sprintf("Dynamic Cluster %d",c),FontSize=8);
end
legend("ActID 1","ActID 2","ActID 3","ActID 4","ActID 5",location="west")
xlabel("Iteration")
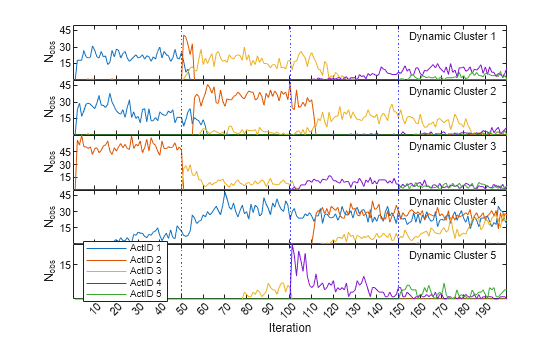
The vertical dotted lines in the plot indicate the iteration number at which a new activity mode appears in the streaming data. Each colored line represents a different activity mode. Only two activity modes are present prior to iteration 50. Observations corresponding to activity mode 1 are split between dynamic clusters 1 and 2, while all the activity mode 2 observations are assigned to cluster 3. As more activity mode observations are introduced during iterations 50 through 200, the algorithm allocates them more evenly among all the dynamic clusters. After the final iteration, activity modes 1, 2, and 3 (sitting, standing, and walking) are all assigned to cluster 4, while activity modes 4 and 5 (running and dancing) are distributed equally among the other clusters.
Plot the simplified silhouette metric for the dynamic clusters to see how it evolves over time. A high metric value indicates that, on average, each observation is well matched to its own cluster and poorly matched to other clusters.
figure
plot(silDynamic.Variables);
xline(5001/numObsPerChunk,"b:")
xline(10001/numObsPerChunk,"b:")
xline(15001/numObsPerChunk,"b:")
xlabel("Iteration")
ylabel("Simplified Silhouette")
xline(Mdl.WarmupPeriod/numObsPerChunk,'g-.')
legend(silDynamic.Properties.VariableNames,Location="southeast")
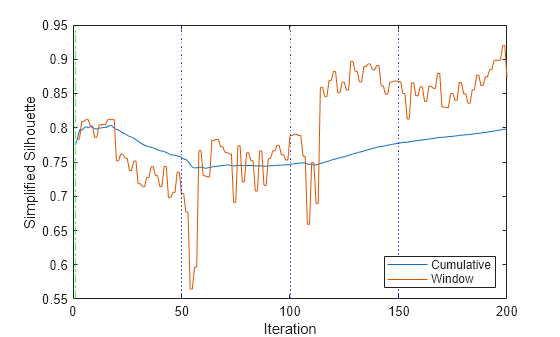
The window metric value falls steadily during the first 50 iterations, and then rises sharply at observations 54 and 113, when the algorithm assigns all of the activity mode 2 observations to a different dynamic cluster. The final metric value is close to the maximum possible value of 1.
More About
Tips
You can create an
incrementalDynamicKMeansmodel object that incorporates the outputs of thekmeansfunction by using the following code:k = 2; [idx,C]=kmeans(X,k); countTable = tabulate(idx); counts = countTable(:,2) Mdl = incrementalDynamicKMeans(centroids=C,ClusterCounts=counts);
References
[1] Liberty, Edo, Ram Sriharsha, and Maxim Sviridenko. An Algorithm for Online K-Means Clustering. In 2016 Proceedings of the Eighteenth Workshop on Algorithm Engineering and Experiments (ALENEX), 81–89. Society for Industrial and Applied Mathematics, 2016.
[2] Lloyd, S. Least Squares Quantization in PCM. IEEE Transactions on Information Theory 28, no. 2 (March 1982): 129–37.
[3] Sculley, D. Web-Scale k-Means Clustering. In Proceedings of the 19th International Conference on World Wide Web, 1177–78. Raleigh North Carolina USA: ACM, 2010.
[4] Vendramin, Lucas, Ricardo J.G.B. Campello, and Eduardo R. Hruschka. On the Comparison of Relative Clustering Validity Criteria. In Proceedings of the 2009 SIAM international conference on data mining, 733–744. Society for Industrial and Applied Mathematics, 2009.
Version History
Introduced in R2025a