insertObjectAnnotation
Annotate truecolor or grayscale image or video
Syntax
Description
___ = insertObjectAnnotation(___,
specifies options using one or more name-value arguments in addition to the previous
syntax. For example, Name=Value)FontSize=18 sets the annotation font size to
18.
Examples
Read an image into the workspace.
I = imread("board.tif");Create confidence value labels using floating point numbers.
label_str = cell(3,1);
conf_val = [85.212 98.76 78.342];
for ii = 1:3
    label_str{ii} = ['Confidence: ' num2str(conf_val(ii), '%0.2f') '%'];
end
Set the positions for the rectangular bounding boxes associated with the labels using the form [x y width height].
position = [23 373 60 66; 35 185 77 81; 77 107 59 26];
Insert the labels into the image.
RGB = insertObjectAnnotation(I,"rectangle",position,label_str,TextBoxOpacity=0.9,FontSize=18);Display the annotated image.
figure
imshow(RGB)
title("Annotated chips")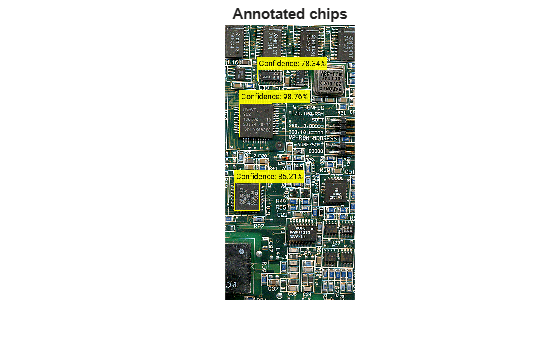
Read an image into the workspace.
I = imread("coins.png");Set the positions on the image for the circular bounding boxes associated with the labels. The first two values of each row specify the center coordinates of a circle, (x,y) and the third value is the radius.
position = [96 146 31; 236 173 26];
Set the values for the labels to display as 5 and 10, in integers. These values represent US currency in the form of a nickle and dime, respectively.
label = [5 10];
Insert the annotations into the image.
RGB = insertObjectAnnotation(I,"circle",position,label,LineWidth=3,AnnotationColor=["cyan","yellow"],FontColor="black");
Display the annotated image.
figure
imshow(RGB)
title("Annotated Coins")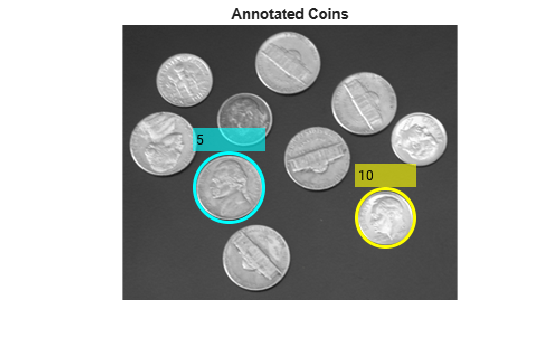
Input Arguments
Input image, specified as an M-by-N-by-3 truecolor or an M-by-N grayscale image.
Data Types: single | double | int16 | uint8 | uint16
Shape of the annotation, specified as "rectangle",
"circle", "projected-cuboid", or
"ellipse". If you specify a "rectangle"
annotation be specify the position of either an axis-aligned or rotated
rectangle.
Data Types: char | string
Position of the shape, specified according to the type of shape, as described in the table.
| Shape | Position | Definition |
|---|---|---|
| For one or more axis-aligned rectangles or filled rectangles, specify as an M-by-4 numeric matrix, where each row specifies a rectangle of the form .
| |
|
For one or more rotated rectangles, specify in spatial coordinates as an M-by-5 numeric matrix, where each row specifies a rotated rectangle of the form [xctr yctr w h yaw].
|  | |
| For one or more circles, specify spatial coordinates as an M-by-3 numeric matrix, where each row specifies a circle of the form [xctr yctr radius].
| |
ellipse | For one or more ellipses, specify in spatial coordinates as an M-by-5 matrix, where each row specifies an ellipse of the form [xctr yctr major minor yaw]
|
|
projected-cuboid | For one or more projected cuboids, specify in spatial coordinates as an 8-by-2-by-M array or an M-by-8 matrix, where M is the number of projected cuboids. When specified as an 8-by-2-by-M array, each row must contain the [x y] location of a projected cuboid vertex. The vertices connect to form a cuboid with six faces. The order of the input vertices must match the order shown in the diagram. When specified as an M-by-8 matrix, each row specifies the dimensions of the front-facing and rear-facing sides of a projected cuboid in the form, [x1 y1 w1 h1 x2 y2 w2 h2], where [x1 y1] and [x2 y2] specify the upper-left coordinates of the front-facing and rear-facing sides, respectively, and [w1 h1] and [w2 h2] specify the corresponding widths and heights. |
|

Data Types: single | double | cell | int8 | int16 | int32 | int64 | uint8 | uint16 | uint32 | uint64
Label to associate with a shape, specified as an M-element numeric vector, string array, vector of categorical labels, or a cell array of ASCII character vectors. If you use character vectors, string scalars, or categorical labels, you must encode them as ASCII characters. If you specify a cell array, it must be equal in length to the number of specified shape positions. You can specify a single label for all shapes using a numeric scalar, string scalar, or scalar categorical label.
Example: [5 10] marks the first shape with the label
5, and the second shape with the label
10.
Name-Value Arguments
Specify optional pairs of arguments as
Name1=Value1,...,NameN=ValueN, where Name is
the argument name and Value is the corresponding value.
Name-value arguments must appear after other arguments, but the order of the
pairs does not matter.
Example: insertObjectAnnotation(I,"rectangle",position,label,FontSize=18);
sets the font size to use for inserting annotations to 18.
Before R2021a, use commas to separate each name and value, and enclose
Name in quotes.
Example: insertObjectAnnotation(I,"rectangle",position,label,"FontSize","18");
sets the font size to use for inserting annotations to 18.
Font face of the label text, specified as a character vector or string scalar. The
font face must be one of the available truetype fonts installed on your system. To get
a list of available fonts on your system, use the listTrueTypeFonts function from the MATLAB® command prompt.
Data Types: char | string
Label text font size, specified as an integer that corresponds to points in the range of
[8 200].
Data Types: double | single | int8 | int16 | int32 | int64 | uint8 | uint16 | uint32 | uint64
Font color, specified as a short color name, color name, vector of color names, three-column matrix of RGB triplets.
The supported colors table lists RGB intensities in the range [0, 1], but you must
specify RGB triplets in the range of your selected data type. For example, if
specifying this argument as a matrix of uint8 values, you must
convert each intensity value to the range [0, 255]. To convert the listed intensity
values to a uint8 data type, use the code
uint8(255*intensity), where intensity is an RGB triplet value
listed in the table.
You can specify a different color for each font string or one color for all
strings. To specify one color for all strings, specify FontColor
as a color name or an [R
G
B] vector.
Data Types: logical | uint8 | uint16 | int16 | double | single
Annotation color, specified as a short color name, color name, vector of color names, three-column matrix of RGB triplets.
The supported colors table lists RGB intensities in the range [0, 1], but you must
specify RGB triplets in the range of your selected data type. For example, if
specifying this argument as a matrix of uint8 values, you must
convert each intensity value to the range [0, 255]. To convert the listed intensity
values to a uint8 data type, use the code
uint8(255*intensity), where intensity is an RGB triplet value
listed in the table.
You can specify a different color for each marker or one color for all markers. To
specify one color for all markers, specify AnnotationColor as a
color name or an [R
G
B] vector.
| Specification | Format | Example |
|---|---|---|
| Specify one color for all shapes (or markers) | Short color name or color name |
|
RGB triplet |
| |
| Specify a color for each shape (or marker) | Vector of color names |
|
Three-column matrix of RGB triplets | [1 0 0 0 1 1 1 0 1 1 1 1]  |

Supported colors are listed in the table.
| Color Name | Short Name | RGB Triplet | Appearance |
|---|---|---|---|
"red" | "r" | [1 0 0] |
|
"green" | "g" | [0 1 0] |
|
"blue" | "b" | [0 0 1] |
|
"cyan" | "c" | [0 1 1] |
|
"magenta" | "m" | [1 0 1] |
|
"yellow" | "y" | [1 1 0] |
|
"black" | "k" | [0 0 0] |
|
"white" | "w" | [1 1 1] |
|
Data Types: cell | char | uint8 | uint16 | int16 | double | single
Opacity of the text label box background, specified as a scalar in the range of [0,
1]. A value of 0 renders the background of the label
text box as fully transparent, while a value of 1 renders it as
fully opaque.
Data Types: double | single | int8 | int16 | int32 | int64 | uint8 | uint16 | uint32 | uint64
Shape border line width, specified as a positive integer, in pixels.
Original orientation indicator, specified as a numeric or logical
1 (true) or 0
(false). A value of 1
(true) displays the original orientation of the rotated rectangle
by using an arrow annotation on the bounding box. The original orientation is defined
as a zero rotation angle. A value of 0 (false)
does not show the arrow annotation.
This argument applies only when Shape describes a rotated
rectangle or an ellipse.
Data Types: logical | integer