Plotting latitude, longitude,and signal strength
Afficher commentaires plus anciens
I have a list of latitude and longitude along with signal strength obtained from mobile towers in a certain region. I have all the data in CSV format. In total, I have 4 CSV files.
How can I plot that data in MATLAB?
As a range of signal strength will be shown by different colour and other range will be shown in different colour.
2 commentaires
Bob Thompson
le 8 Jan 2019
Simran Sandhu
le 8 Jan 2019
Modifié(e) : Simran Sandhu
le 8 Jan 2019
Réponse acceptée
KSSV
le 9 Jan 2019
0 votes
Read about pcolor, surf, scatter, conourf. All these can be used to plot what you want.
The below link shows the possible plots which can be obtained from MATLAB. YOu can have a look on the link, it has a plot and respective code from which you can learn.
8 commentaires
Simran Sandhu
le 9 Jan 2019
Simran Sandhu
le 9 Jan 2019
KSSV
le 9 Jan 2019
[num,txt,raw] = xlsread('powerlevel.csv') ;
lat = num(:,1) ;
lon = num(:,2) ;
val = num(:,3) ;
scatter(lon,lat,10,val,'filled') ; colorbar
Simran Sandhu
le 9 Jan 2019
KSSV
le 9 Jan 2019
YOu have any other data? Or the only above data? The second figure is plotted using contour.
Simran Sandhu
le 9 Jan 2019
To use contour you should be having a matrix data. With your data..this is what I can get:
[num,txt,raw] = xlsread('powerlevel.csv') ;
lat = num(:,1) ;
lon = num(:,2) ;
val = num(:,3) ;
scatter(lon,lat,10,val,'filled') ; colorbar
m = 100 ;
x = linspace(min(lon),max(lon),m) ;
y = linspace(min(lat),max(lat),m) ;
[X,Y] = meshgrid(x,y) ;
Z = griddata(lon,lat,val,X,Y) ;
contour(X,Y,Z) ;
Simran Sandhu
le 9 Jan 2019
Plus de réponses (1)
Jacob Halbrooks
le 3 Avr 2020
0 votes
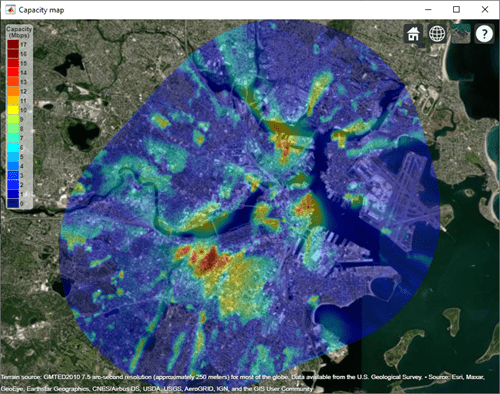
A new feature is available in R2020a to support importing and visualizing propagation data like this. The feature is available in Communications Toolbox and Antenna Toolbox and supports table-based files or data which contains latitude, longitude, and corresponding values like signal strength. You can learn about the feature here, and below is an example contour map that you can create with it:
Catégories
En savoir plus sur Geographic Plots dans Centre d'aide et File Exchange
Produits
le 8 Jan 2019
le 3 Avr 2020
Community Treasure Hunt
Find the treasures in MATLAB Central and discover how the community can help you!
Start Hunting!
Translated by ![]()