Can someone please convert the Matlab code to Python code??
Afficher commentaires plus anciens
%upload image of farm
figure,
farm = imread('small_farms.JPG');%change this to the file path of image
imshow(farm);%this shows the original image
%convert the image to grayscale for 2D manipulation
gfarm = rgb2gray(farm);
figure,
imshow(gfarm);%show grayscaled image
%median filters take a m*n area around a coordinate and
%find the median pixel value and set that coordinate to that
%pixel value. It's a method of removing noise or details in an
%image. may want to tune dimensions of filter.
A = medfilt2(gfarm,[4 4]);
figure,
imshow(A);
%perform a logarithmic edge detection filter,
%this picks out the edges of the image, log setting
%was found to wrok best, although 'Sobel' can also be tried
B = edge(A,'log');
%show results of the edge filter
figure,
imshow(B,[]);
%find the areas of the lines made
areas = regionprops(B,'Area');
%find the mean and one standard deviation
men = mean([areas.Area])+0*std([areas.Area]);
%find max pixel area
big = max([areas.Area]);
%remove regions that are too small
C = bwpropfilt(B,'Area',[men big]);
%perform a dilation on the remaining pixels, this
%helps fill in gaps. The size and shape of the dilation
%can be tuned below.
SE = strel('square',4);
C = imdilate(C,SE);
areas2 = regionprops(C,'Area');
%place white border around image to find areas of farms
%that go off the picture
[h,w] = size(C);
C(1,:) = 1;
C(:,1) = 1;
C(h,:) = 1;
C(:,w) = 1;
C = C<1;
%fill in holes
C = imfill(C,'holes');
%show final processed image
figure,imshow(C);
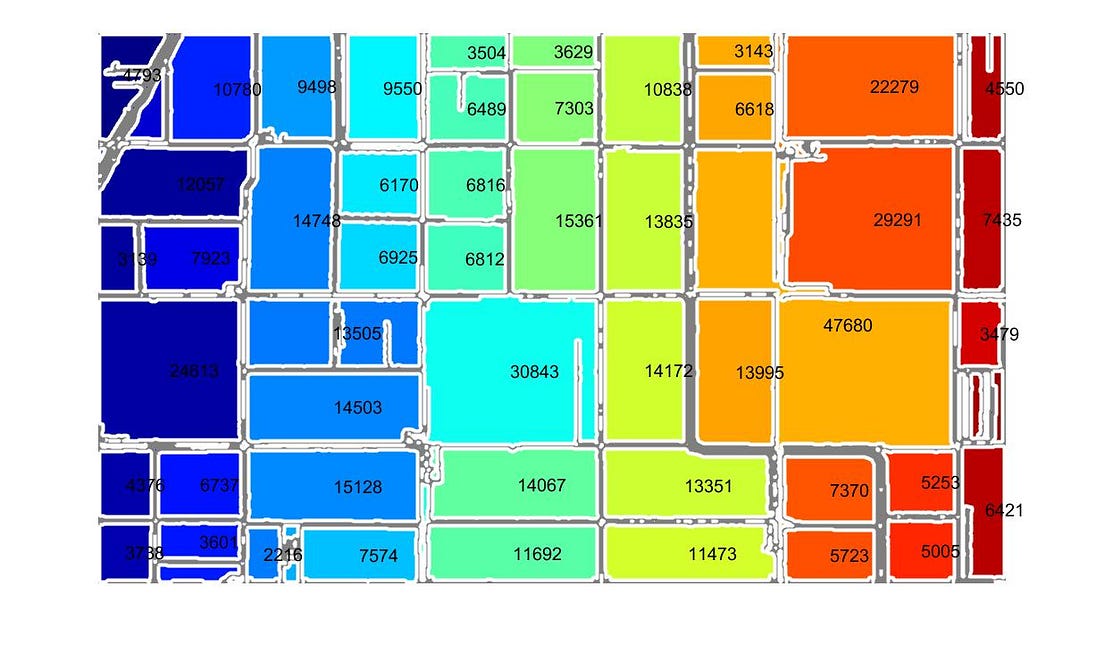
%the section below is for display purpose
%it creates the boundaries of the image and displays them
%in a rainbow fashion
figure,
[B,L,n,A] = bwboundaries(C,'noholes');
imshow(label2rgb(L, @jet, [.5 .5 .5]))
hold on
for k = 1:length(B)
boundary = B{k};
plot(boundary(:,2), boundary(:,1), 'w', 'LineWidth', 2)
end
%The section below prints out the areas of each found
%region by pixel values. These values need to be scaled
%by the real measurements of the images to get relevant
%metrics
centers = regionprops(C,'Centroid','Area');
for k=1:length(centers)
if(centers(k).Area > mean([centers.Area])-std([areas.Area]))
text(centers(k).Centroid(1),centers(k).Centroid(2),string(centers(k).Area));
end
end
Réponses (0)
Catégories
En savoir plus sur Call Python from MATLAB dans Centre d'aide et File Exchange
le 23 Avr 2020
le 23 Avr 2020
Community Treasure Hunt
Find the treasures in MATLAB Central and discover how the community can help you!
Start Hunting!
Translated by ![]()