
Vous suivez désormais cette soumission
- Les mises à jour seront visibles dans votre flux de contenu suivi
- Selon vos préférences en matière de communication il est possible que vous receviez des e-mails
Citation pour cette source
Adam Aitkenhead (2026). Plot a 3D array using patch (https://fr.mathworks.com/matlabcentral/fileexchange/28497-plot-a-3d-array-using-patch), MATLAB Central File Exchange. Extrait(e) le .
Remerciements
A inspiré : Spectral Imaging Toolbox
Informations générales
- Version (197 ko)
Compatibilité avec les versions de MATLAB
- Compatible avec toutes les versions
Plateformes compatibles
- Windows
- macOS
- Linux
| Version | Publié le | Notes de version | Action |
|---|---|---|---|
| 1.11.0 | The user can now define the lower and upper limits of the colorbar using the input parameter 'clim'. Also, the input flag 'sym' has been removed as this can be done using clim instead. |
||
| 1.9.0 | Provide the handle to the colorbar as an optional output. |
||
| 1.8.0 | Some minor code optimisations |
||
| 1.7.0 | Bugfix: Prevent a hole from appearing at the lowest values in a full colour plot. |
||
| 1.5.0 | The user can now specify the colour map for the display of a 3D numeric array. |
||
| 1.4.0 | Minor bugfix |
||
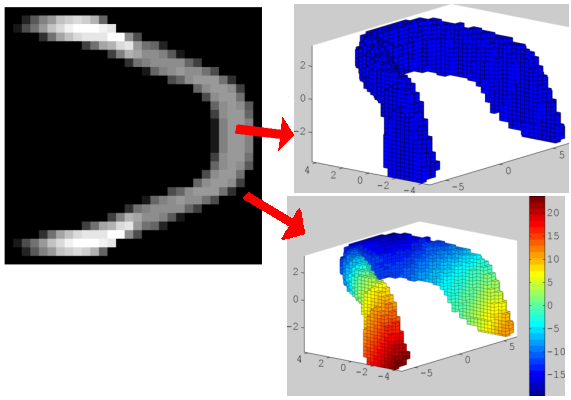
| 1.3.0 | Now enables a 3D numeric array to be plotted such that each facet corresponds to the value of each voxel in the array. |
||
| 1.2.0 | Added missing example.mat file |
||
| 1.1.0 | Improved documentation |
||
| 1.0.0 |

