camroll
Description
camroll( sets
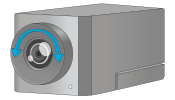
the roll angle of the camera for the specified Site Viewer. Setting the roll angle rotates
the camera around its lens. For more information about how camera rotations affect your view
of the Site Viewer, see How Camera Orientation Affects View.viewer,roll)
This function requires the CoordinateSystem property of the Site
Viewer object to be "geographic".
camroll( displays the roll angle of the
camera.viewer)
Examples
Create a Site Viewer. By default, Site Viewer displays a 3-D globe using satellite imagery. Verify that the CoordinateSystem property of the Site Viewer object is "geographic".
viewer = siteviewer;
viewer.CoordinateSystem
ans =
"geographic"
Position the camera near Mount Kilimanjaro by specifying a latitude, longitude, and ellipsoidal height. Set the pitch angle to 0 degrees, so that the camera points across the summit.
campos(viewer,-3.1519,37.3561,5500)
campitch(viewer,0)
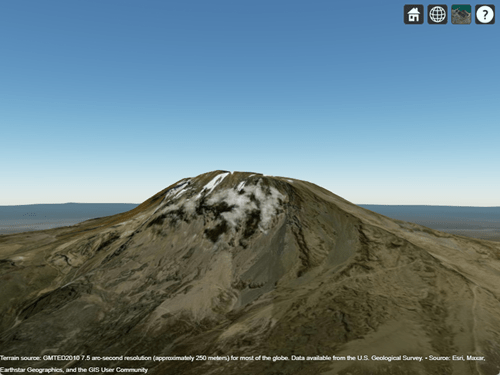
Query the roll angle. The output roll angle is 360 degrees, which is equivalent to a roll angle of 0 degrees.
rollOut = camroll(viewer)
rollOut =
360
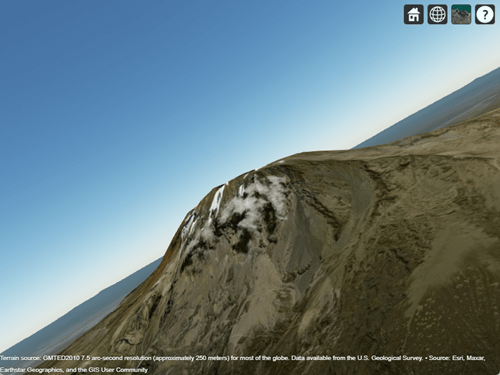
Rotate the camera in a clockwise direction by changing the roll angle to 30 degrees. When you rotate the camera in a clockwise direction, the mountain appears to move in a counterclockwise direction.
camroll(viewer,30)
When you display data in a Site Viewer, the Site Viewer focuses on the data by moving the camera. To preserve the camera view, before you plot the data, query the camera position and camera angles. Then, after you plot the data, reset the camera position and camera angles.
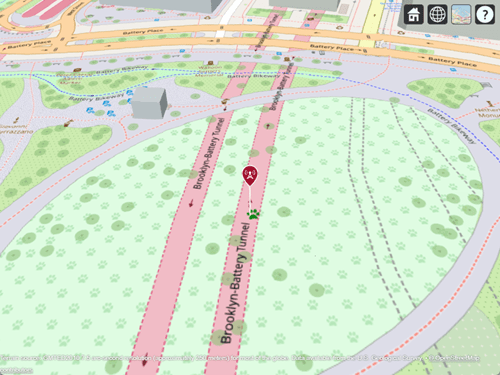
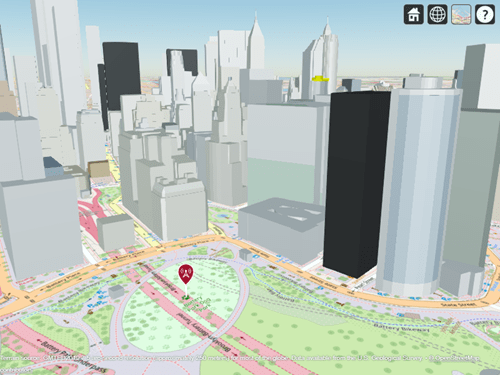
Create a Site Viewer that displays buildings in Manhattan. For more information about the OpenStreetMap® file, see [1]. Navigate to an area of interest by interacting with the Site Viewer.
viewer = siteviewer(Buildings="manhattan.osm",Basemap="openstreetmap");
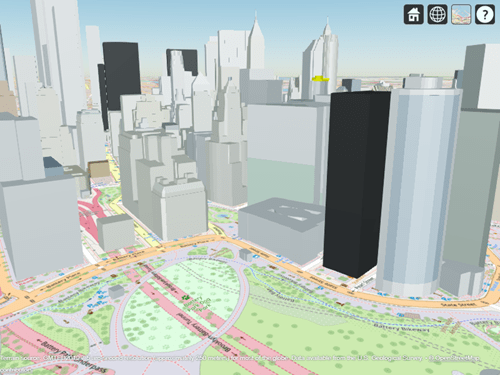
Query the position of the camera and the heading, pitch, and roll angles of the camera. Assign each value to a variable.
[lat,lon,height] = campos(viewer);
heading = camheading(viewer);
pitch = campitch(viewer);
roll = camroll(viewer);
Create and display a transmitter site. Note that the camera zooms to the site.
tx = txsite(Latitude=40.704,Longitude=-74.0155);
show(tx)
Reset the view using the stored camera position and camera angles.
campos(viewer,lat,lon,height)
camheading(viewer,heading)
campitch(viewer,pitch)
camroll(viewer,roll)
[1] The OpenStreetMap file is downloaded from https://www.openstreetmap.org, which provides access to crowd-sourced map data all over the world. The data is licensed under the Open Data Commons Open Database License (ODbL), https://opendatacommons.org/licenses/odbl/.
Input Arguments
Output Arguments
More About
You can control the view of a Site Viewer by changing the heading, pitch, and roll angles of
the camera. The interpretation of the angles depends on the
CoordinateSystem property of the Site Viewer object.
Geographic Coordinate System
When the CoordinateSystem property of the Site Viewer object is
"geographic", you can control the view of the 3-D globe by changing
the heading, pitch, and roll angles.
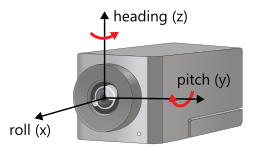
Heading — Rotate the camera about its z-axis, which rotates the view left or right. Rotate the view to the right by increasing the heading angle.
Pitch — Rotate the camera about its y-axis, which tilts the view up or down. Tilt the view up by increasing the pitch angle.
Roll — Rotate the camera about its x-axis, which spins the camera around its lens. Spin the view counterclockwise by increasing the roll angle.

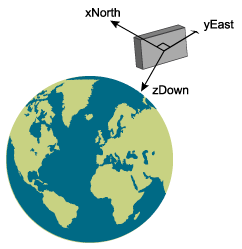
Site Viewer references the camera to the globe using a north-east-down (NED) coordinate system. When the heading, pitch, and roll angles of the camera are zero, the camera sits on a plane that is parallel to the tangent plane of the globe at the current latitude and longitude. For more information about NED coordinate systems, see Comparison of 3-D Coordinate Systems (Mapping Toolbox).
Cartesian Coordinate System
When the CoordinateSystem property of the Site Viewer object is
"cartesian", you can control the view of the 3-D model by changing
the heading and pitch angles. Changing the roll angle is not supported.
Heading — Rotate the camera about its z-axis, which rotates the view left or right. Rotate the view to the right by decreasing the heading angle.
Pitch — Rotate the camera about its y-axis, which tilts the view up or down. Tilt the view up by increasing the pitch angle.
Site Viewer references the camera to the scene using a right-handed Cartesian coordinate system, where the z-axis points up. When the heading and pitch angles of the camera are zero, the camera sits on a plane that is parallel to the xy-plane of the scene.
Tips
When the pitch angle is near –90 or 90 degrees, the camera loses one rotational degree of
freedom. As a result, when you change the roll angle, the heading angle might change instead.
This phenomenon is called gimbal lock. To avoid the effects of gimbal
lock, call the camheading function instead of the
camroll function.
Version History
Introduced in R2025a
1 Alignment of boundaries and region labels are a presentation of the feature provided by the data vendors and do not imply endorsement by MathWorks®.