sectorplot
R2026bPlot sector index as function of frequency
Syntax
Description
The sectorplot function plots the sector indices of a
dynamic system
model. To customize the plot, you can return a SectorPlot
object and modify it using dot notation. For more information, see Customize Linear Analysis Plots at Command Line.
To obtain sector indices, use the sector
function.
sectorplot(
plots the relative sector indices for the dynamic system H,Q)H
and a given sector matrix Q. These indices measure by how
much the sector bound is satisfied (index less than 1) or violated (index
greater than 1) at a given frequency. (See About Sector Bounds and Sector Indices
for more information about the meaning of the sector index.)
sectorplot automatically chooses the frequency range
and number of points based on the dynamics of H.
Let the following be an orthogonal decomposition of the symmetric matrix
Q into its positive and negative parts.
The sector index plot is only meaningful if has a proper stable inverse. In that case, the sector indices are the singular values of:
If H is a model with complex coefficients, then
in:
Log frequency scale, the plot shows two branches, one for positive frequencies and one for negative frequencies. The arrows indicate the direction of increasing frequency values for each branch.
Linear frequency scale, the plot shows a single branch with a symmetric frequency range centered at a frequency value of zero.
sectorplot(___, plots
the sector index for frequencies specified by w)w. You can
specify a frequency range or a vector of frequencies.
You can use this syntax with any of the previous input-argument combinations.
sectorplot(___,
plots the sector index with the options set specified in
plotoptions)plotoptions. You can use these options to customize the
plot appearance using the command line. Settings you specify in
plotoptions override the preference settings in the
MATLAB® session in which you run sectorplot.
Therefore, this syntax is useful when you want to write a script to generate
multiple plots that look the same regardless of the local preferences.
sectorplot(___,
specifies response properties using one or more name-value arguments. For
example, Name=Value)sectorplot(sys,Color="r") sets the plot color to
red. (since R2026b)
When plotting responses for multiple systems, the specified name-value arguments apply to all responses.
The following name-value arguments override values specified in other input arguments.
sectorplot(
plots the sector indices in the specified parent graphics container, such as a
parent,___)Figure or TiledChartLayout, and sets the
Parent property. Use this syntax when you want to
create a plot in a specified open figure or when creating apps in App
Designer. (since R2026b)
sp = sectorplot(___)
Examples
Plot the sector index to visualize the frequencies at which the I/O trajectories of lie within the sector defined by:
In U/Y space, this sector is the shaded region of the following diagram.
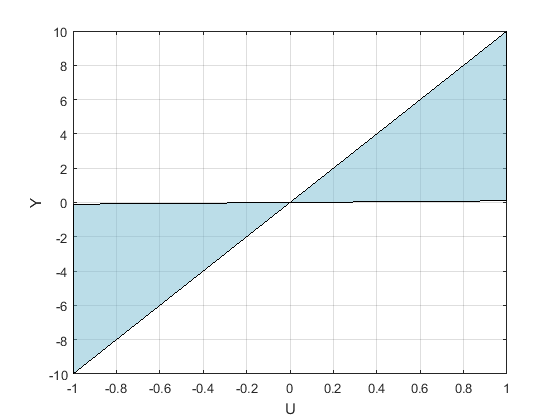
The Q matrix for this sector is given by:
a = 0.1;
b = 10;
Q = [1 -(a+b)/2 ; -(a+b)/2 a*b];
A trajectory lies within the sector S when for all T > 0,
In the frequency domain, this same condition can be expressed as:
To check whether G satisfies or violates this condition at any frequency, plot the sector index for H = [G;1].
G = tf([1 2],[1 1]);
sectorplot([G;1],Q)
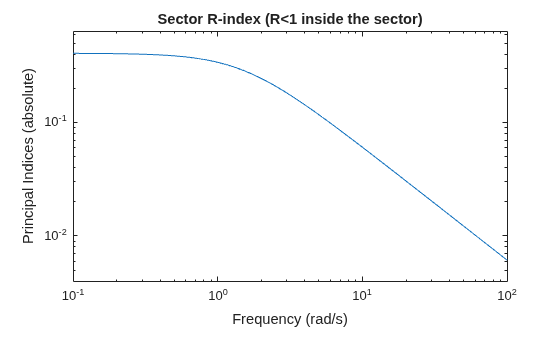
The plot shows that the sector index is less than 1 at all frequencies. Therefore, the trajectories of G(s) fit within in the specified sector Q at all frequencies.
Examine the sector plot of a 2-output, 2-input system for a particular sector. Load the system, H1, and define the sector, Q.
load("sectorExampleSystem.mat","H1")
Q = [-5.12   2.16  -2.04   2.17
      2.16  -1.22  -0.28  -1.11
     -2.04  -0.28  -3.35   0.00
      2.17  -1.11   0.00   0.18];
Create the plot.
sectorplot(H1,Q)
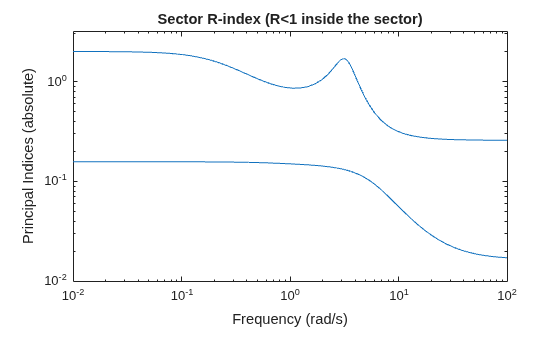
Because H is 2-by-2, there are two lines on the sector plot. The largest value of the sector index exceeds 1 below about 0.5 rad/s and in a narrow band around 3 rad/s. Therefore, H does not satisfy the sector bound represented by Q.
Plot the relative sector indices of a model with complex coefficients and a model with real coefficients on the same plot.
Create a system with complex coefficients.
A = [-3.50,-1.25-0.25i;2,0];
B = [1;0];
C = [-0.75-0.5i,0.625-0.125i];
D = 0.5;
Hc = [ss(A,B,C,D);1];
Load a system with real coefficients.
load("sectorExampleSystem.mat","Hr")
Plot the relative sector indices of both systems.
Q = [1 0.1;0.1 -1];
sectorplot(Hc,Hr,Q)
legend("Complex-coefficient model","Real-coefficient model", ...
    Location="southwest");
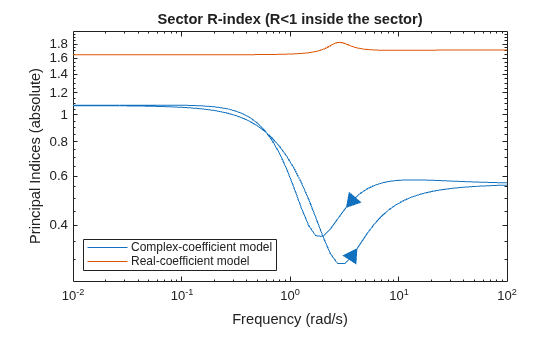
In log frequency scale, the plot shows two branches for models with complex coefficients, one for positive frequencies, with a right-pointing arrow, and one for negative frequencies, with a left-pointing arrow. In both branches, the arrows indicate the direction of increasing frequencies. The plots for models with real coefficients always contain a single branch with no arrows.
Set the plotting frequency scale to linear.
opt = sectorplotoptions;
opt.FreqScale = "Linear";
Plot the indices.
sectorplot(Hc,Hr,Q,opt)
legend("Complex-coefficient model","Real-coefficient model", ...
    Location="southwest");
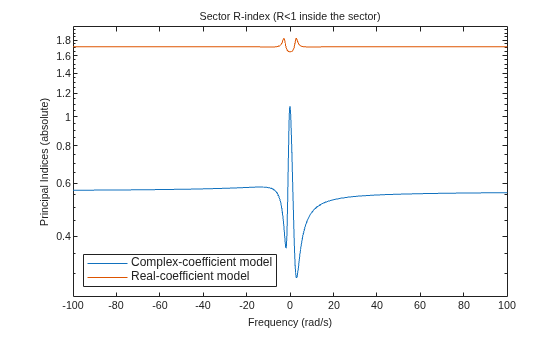
In linear frequency scale, the plots show a single branch with a symmetric frequency range centered at a frequency value of zero. The plot also shows the negative-frequency response of a model with real coefficients when you plot the response along with a model with complex coefficients.
Input Arguments
Name-Value Arguments
Output Arguments
Version History
Introduced in R2016aSee Also
sectorplotoptions | sector | getSectorIndex | getPassiveIndex | passiveplot

