Out-of-Distribution Detection for ECG Signal Classification
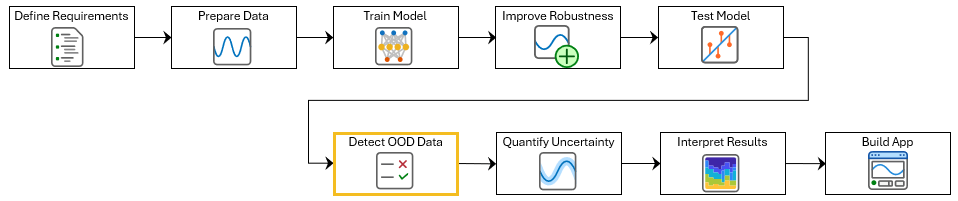
This example shows how to detect out-of-distribution (OOD) data in deep neural networks for ECG signal classification. This example is step six in a series of examples that take you through an ECG signal classification workflow. This example follows the Test Deep Learning Network for ECG Signal Classification example. For more information about the full workflow, see ECG Signal Classification Using Deep Learning.
To run this example, open ECG Signal Classification Using Deep Learning and navigate to scripts\S6_OutOfDistributionDetection. Alternatively, if you already have MATLAB open, then run
openExample("deeplearning_shared/ECGSignalClassificationUsingDeepLearningExample")This project contains all of the steps for this workflow. You can run the scripts in order or run each one independently.
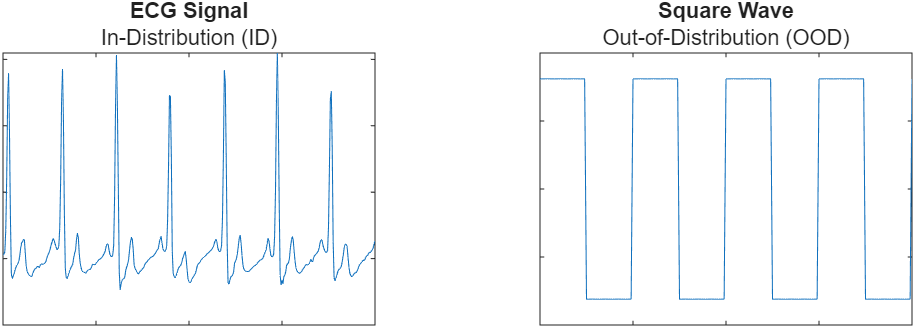
Out-of-distribution (OOD) data detection is the process of identifying inputs to a deep neural network that differ significantly from the training data and can lead to unreliable predictions. In ECG signal classification, OOD data might include signals recorded using different devices, under different conditions, or from populations not represented in the training set. Data that is used to train the model or is sufficiently similar to the training data is referred to as in-distribution (ID) data.
This example shows how to simulate flatline ECG signals using random noise and then train a discriminator to detect them as OOD.
Load the training data. If you have run the previous step, Prepare Data for ECG Signal Classification, then the example uses the data that you prepared in that step. Otherwise, the example prepares the data as shown in Prepare Data for ECG Signal Classification.
if  ~exist("XTrain","var") || ~exist("TTrain","var")
    [XTrain,TTrain] = prepareECGData;
end
Load a pretrained network. If you have run the robust training step, Improve Adversarial Robustness of Deep Learning Network for ECG Signal Classification, then the example uses your trained network. Otherwise, load a pretrained network that has been trained using the steps shown in Improve Adversarial Robustness of Deep Learning Network for ECG Signal Classification.
if ~exist("netRobust","var")
    load("adversariallyTrainedECGNetwork.mat");
end
Generate OOD Data
To classify data as in- or out-of-distribution, create a distribution discriminator. To create and train a discriminator, you need in-distribution and out-of-distribution data.
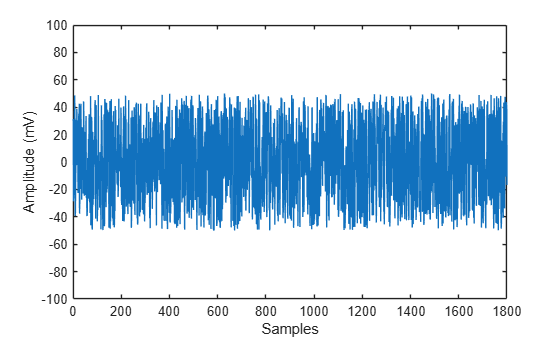
Use uniform random noise to simulate flatline ECG signals as OOD data. You will use the data on which the model was trained as ID data.
rng(0)

dataID = cell2mat(XTrain);
dataOOD = unifrnd(-50,50,size(dataID));
Plot the first simulated OOD signal.
figure
plot(dataOOD(1,:))
ylim([-100 100])
xlabel("Samples")
ylabel("Amplitude (mV)")
Create Distribution Discriminator
Use the networkDistributionDiscriminator function to create a distribution discriminator. A distribution discriminator assigns a confidence score to each input. ID data typically yields higher scores than OOD signals. The function then computes a threshold that optimally separates ID and OOD data based on their scores. In this example, the discriminator uses the HBOS method, which computes a score by binning the specified layer activations and summing their log-histogram probabilities. This method works well because OOD inputs tend to produce activation patterns that occur infrequently in the ID distribution. For more information about how to compute distribution confidence scores, see Distribution Confidence Scores.
XID = dlarray(dataID,"BTC");
XOOD = dlarray(dataOOD,"BTC");

method = "hbos";
To train the discriminator, set the doTraining flag to true. Set the doTraining flag to false to load a pretrained discriminator instead.
doTraining =false; if doTraining discriminator = networkDistributionDiscriminator(netRobust,XID,XOOD,method,VerbosityLevel=2,LayerNames="fc"); else load("DistributionDiscriminator.mat","discriminator"); end discriminator.Threshold
ans = single

-2.8025
Visualize Distribution Confidence Scores
Use the distributionScores function to compute scores for both ID and OOD data. Then, use the plotDistributionScores helper function, which is defined at the end of this example, to visualize the score distributions and the threshold the discriminator uses to classify inputs.
scoresID = distributionScores(discriminator,XID);
scoresOOD = distributionScores(discriminator,XOOD);

figure
plotDistributionScores(discriminator,scoresID,scoresOOD)
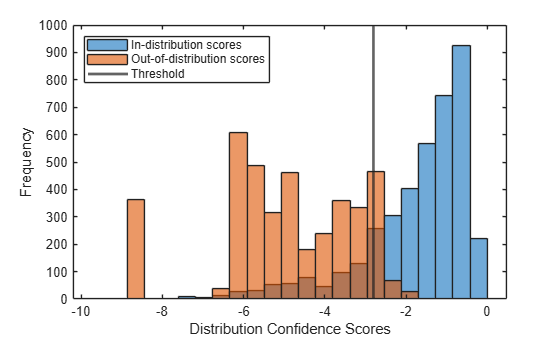
The histogram shows how the discriminator separates ID and OOD data based on their distribution scores. The vertical line indicates the threshold. Inputs with scores less than or equal to the threshold are classified as OOD. Most of the OOD scores are distributed below the threshold.
Assess Performance of Distribution Discriminator
Classify data as ID or OOD with the discriminator by using the isInNetworkDistribution function.
tfOOD = isInNetworkDistribution(discriminator,XOOD);
tfID = isInNetworkDistribution(discriminator,XID);
Evaluate the performance of the discriminator by computing its true positive rate (TPR) and false positive rate (FPR).
TPR = nnz(tfID)/numel(tfID)
TPR =
0.8394
FPR = nnz(tfOOD)/numel(tfOOD)
FPR =
0.0525
You can now identify and exclude out-of-distribution data. However, predictions on in-distribution data can still have some uncertainty. In the next step of the workflow, you use split conformal prediction to quantify that uncertainty and generate statistically valid prediction sets.
Supporting Functions
function plotDistributionScores(discriminator,scoresID,scoresOOD)
hID = histogram(scoresID);
hold on
hOOD = histogram(scoresOOD);
xl = xlim;
hID.BinWidth = (xl(2)-xl(1))/25;
hOOD.BinWidth = (xl(2)-xl(1))/25;
xline(discriminator.Threshold,LineWidth=2)

legend(["In-distribution scores","Out-of-distribution scores","Threshold"],Location="northwest");
xlabel("Distribution Confidence Scores")
ylabel("Frequency")
hold off
end
See Also
networkDistributionDiscriminator | isInNetworkDistribution