laneMarking
Create road lane marking object
Syntax
Description
Single Marking Type Along Lane
lm = laneMarking(type)lanespec
object.
lm = laneMarking(type,Name,Value)laneMarking('Solid','Color','yellow') creates a solid yellow
lane marking.
Multiple Marking Types Along Lane
cm = laneMarking(lmArray)lmArray. Use this syntax to generate lane markings that contain
multiple marker types.
For example, create a lane boundary marking that has both solid and dashed marking
types by defining
lmArray.
lmArray = [laneMarking('Solid') laneMarking('Dashed')]
cm = laneMarking(lmArray)Examples
Create a driving scenario and the road centers for a straight, 80-meter road.
scenario = drivingScenario;
roadCenters = [0 0; 80 0];
Create a lanespec object for a four-lane road. Use the laneMarking function to specify its five lane markings. The center line is double-solid and double yellow. The outermost lines are solid and white. The inner lines are dashed and white.
solidW = laneMarking('Solid','Width',0.3);
dashW = laneMarking('Dashed','Space',5);
doubleY = laneMarking('DoubleSolid','Color','yellow');
lspec = lanespec([2 2],'Width',[5 5 5 5], ...
    'Marking',[solidW dashW doubleY dashW solidW]);
Add the road to the driving scenario. Display the road.
road(scenario,roadCenters,'Lanes',lspec);
plot(scenario)
Simulate a driving scenario with one car traveling on an S-curve. Create and plot the lane boundaries.
Create the driving scenario with one road having an S-curve.
scenario = drivingScenario('StopTime',3);
roadcenters = [-35 20 0; -20 -20 0; 0 0 0; 20 20 0; 35 -20 0];
Create the lanes and add them to the road.
lm = [laneMarking('Solid','Color','w'); ...
    laneMarking('Dashed','Color','y'); ...
    laneMarking('Dashed','Color','y'); ...
    laneMarking('Solid','Color','w')];
ls = lanespec(3,'Marking',lm);
road(scenario,roadcenters,'Lanes',ls);
Add an ego vehicle and specify its trajectory from its waypoints. By default, the car travels at a speed of 30 meters per second.
car = vehicle(scenario, ...
    'ClassID',1, ...
    'Position',[-35 20 0]);
waypoints = [-35 20 0; -20 -20 0; 0 0 0; 20 20 0; 35 -20 0];
smoothTrajectory(car,waypoints);
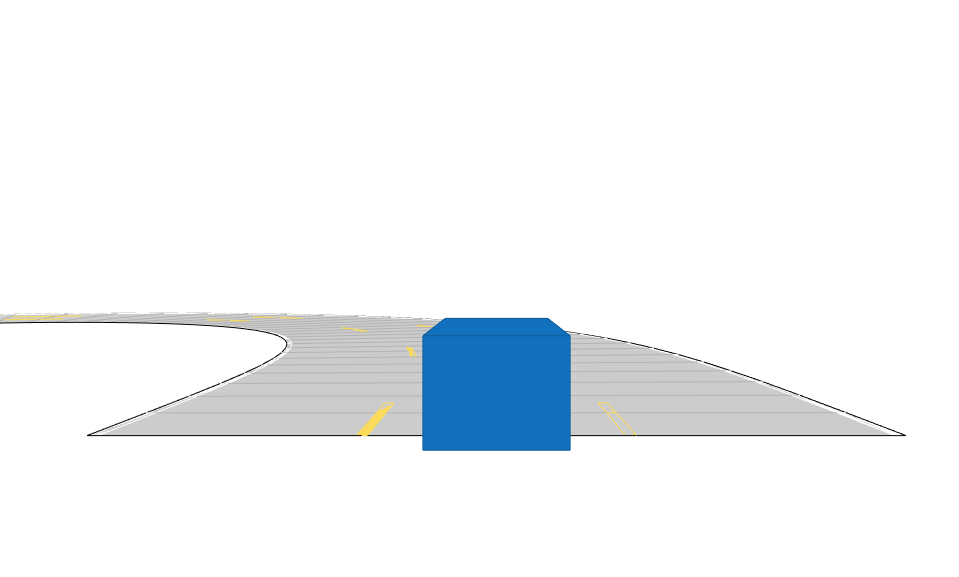
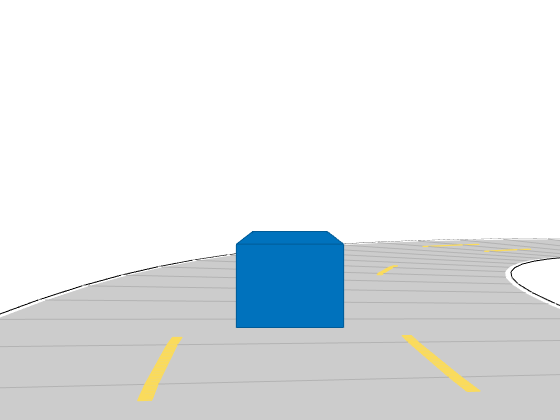
Plot the scenario and corresponding chase plot.
plot(scenario)
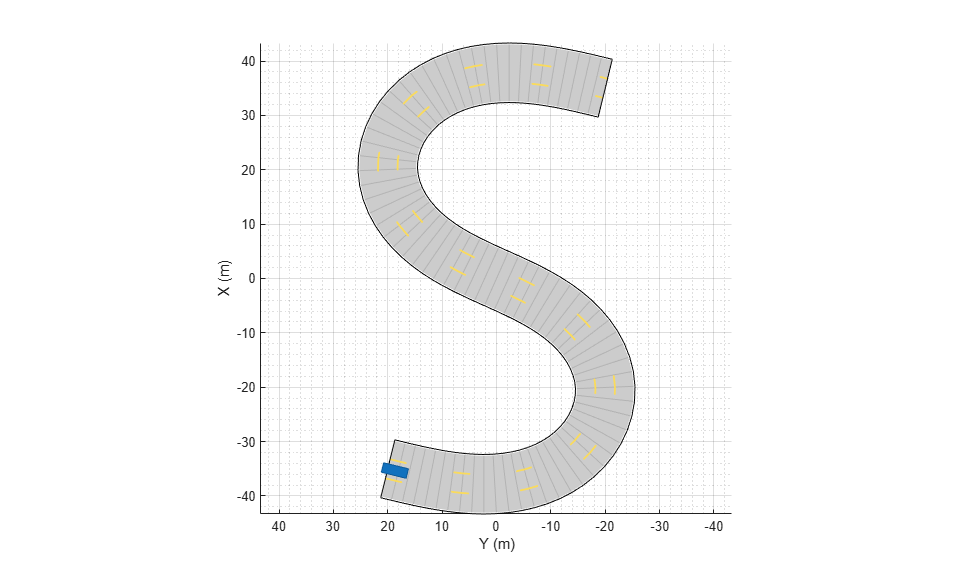
chasePlot(car)
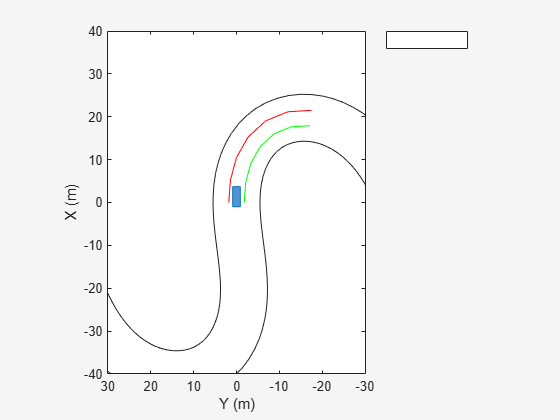
Run the simulation loop.
Initialize a bird's-eye plot and create an outline plotter, left-lane and right-lane boundary plotters, and a road boundary plotter.
Obtain the road boundaries and rectangular outlines.
Obtain the lane boundaries to the left and right of the vehicle.
Advance the simulation and update the plotters.
bep = birdsEyePlot('XLim',[-40 40],'YLim',[-30 30]);
olPlotter = outlinePlotter(bep);
lblPlotter = laneBoundaryPlotter(bep,'Color','r','LineStyle','-');
lbrPlotter = laneBoundaryPlotter(bep,'Color','g','LineStyle','-');
rbsEdgePlotter = laneBoundaryPlotter(bep);
legend('off');
while advance(scenario)
    rbs = roadBoundaries(car);
    [position,yaw,length,width,originOffset,color] = targetOutlines(car);
    lb = laneBoundaries(car,'XDistance',0:5:30,'LocationType','Center', ...
        'AllBoundaries',false);
    plotLaneBoundary(rbsEdgePlotter,rbs)
    plotLaneBoundary(lblPlotter,{lb(1).Coordinates})
    plotLaneBoundary(lbrPlotter,{lb(2).Coordinates})
    plotOutline(olPlotter,position,yaw,length,width, ...
        'OriginOffset',originOffset,'Color',color)
end

This example shows how to create a driving scenario for maneuvers such as changing lanes and passing other vehicles. You create roads with passing zones and add vehicles to the scenario. Then, define the trajectories for these vehicles to simulate vehicle lane change in passing zones.
Create Road with Passing Zones by Using Composite Lane Marking
Create a driving scenario. Specify the road centers and the number of lanes to add a two-way, two-lane straight road of 54 meters with draw direction from top-to-bottom.
scenario = drivingScenario('StopTime',10);
roadCenters = [50 0; -4 0];
numLanes = [1 1];
Typically, the number of lane markings is equal to number of lanes plus one. A two-way, two-lane road has 3 lane markings and the outermost lane markings at both the edges are solid white lines.
Create a solid marking object of marking width 0.25 meters, to constitute the outermost lane markings for the two-way road.
outerLM = laneMarking('Solid','Width',0.25);
Create a lane marking array of SolidMarking and DashedMarking objects that contain the properties for solid and dashed double yellow lines.
lmArray = [laneMarking('DoubleSolid','Color','Yellow','Width',0.25)
           laneMarking('DashedSolid','Color','Yellow','Length',1,'Space',1.5,'Width',0.25)
           laneMarking('DoubleSolid','Color','Yellow','Width',0.25)
           laneMarking('SolidDashed','Color','Yellow','Length',1,'Space',1.5,'Width',0.25)];
Create a composite lane marking object for the center lane marking by using the lane marking array. Specify the normalized length for each marking object.
centerLM = laneMarking(lmArray,'SegmentRange',[0.1 0.25 0.2 0.35]);Create a vector of the outermost and the center lane marking objects. Pass the vector as input to the lanespec function in order to define the lane specifications of the road.
marking = [outerLM centerLM outerLM];
ls = lanespec(numLanes,'Width',7,'Marking',marking);
Add the road to the driving scenario. Plot the driving scenario. Since the draw direction of the road is from top-to-bottom, the marking types in the composite lane marking also occur in top-to-bottom order.
road(scenario,roadCenters,'Lanes',ls);
figMark = figure;
set(figMark,'Position',[0 0 600 600]);
hPlot = axes(figMark);
plot(scenario,'Parent',hPlot);
title('Composite Marking: Road with Passing Zones')

Simulate Vehicle Lane Change in Passing Zones
Add a slow moving vehicle (SMV) to the scenario. Specify the waypoints and speed value to set the trajectory for the SMV.
slowVehicle = vehicle(scenario,'ClassID',1,'Position',[37 -3 0]);
waypoints = [37 -3;12 -3];
speed = 2;
smoothTrajectory(slowVehicle,waypoints,speed);
Add another vehicle to the scenario. Set the trajectory for the vehicle in such a way that it passes the SMV in front of it by changing lanes at the passing zones.
passingVehicle = vehicle(scenario,'ClassID',1,'Position',[49 -3 0]);
waypoints = [49 -3; 45 -3; 40 -3; 35 0;
             30 3; 26 3; 22 3; 18 3;
             8 0; 5 -2; 2 -3; 1 -3];
speed = 6;
smoothTrajectory(passingVehicle,waypoints,speed);
Create a custom figure window and plot the scenario.
close all;
figScene = figure;
set(figScene,'Position',[0 0 600 600]);
hPanel = uipanel(figScene);
hPlot = axes(hPanel);
plot(scenario,'Parent',hPlot);
title('Passing Zone: Change Lane and Pass Other Vehicle')

% Run the simulation
while advance(scenario)
    pause(0.01)
end

Input Arguments
Type of lane marking, specified as one of these values.
'Unmarked' | 'Solid' | 'Dashed' | 'DoubleSolid' | 'DoubleDashed' | 'SolidDashed' | 'DashedSolid' |
|---|---|---|---|---|---|---|
No lane marking | Solid line | Dashed line | Two solid lines | Two dashed lines | Solid line on left, dashed line on right | Dashed line on left, solid line on right |
|
|
|
|
|
|
|
|


The type of lane marking is stored in Type, a read-only property
of the returned lane marking object.
1-D array of lane marking objects, specified as
LaneMarkingobject for'Unmarked'type of lane marking.SolidMarkingobject for'Solid'and'DoubleSolid'types of lane marking.DashedMarkingobject for'Dashed','DoubleDashed','SolidDashed', and'DashedSolid'types of lane marking.
Example: lmArray = [laneMarking('Solid')
laneMarking('Dashed')]
Range for each marking type, specified as a vector with normalized values in the
interval [0, 1]. The length of the vector must be same as the number of marking types
specified in the input array lmArray.
The default range value for each marking type in the lane is the inverse of the
number of marking types specified in lmArray.
For example, if the input lane marking array contains three lane marking objects,
such as lmArray = [laneMarking('Solid') laneMarking('Dashed')
laneMarking('Solid')], then the default range value for each marking type is
1/3, that is range = [0.3330 0.3330 0.3330].
Name-Value Arguments
Specify optional pairs of arguments as
Name1=Value1,...,NameN=ValueN, where Name is
the argument name and Value is the corresponding value.
Name-value arguments must appear after other arguments, but the order of the
pairs does not matter.
Before R2021a, use commas to separate each name and value, and enclose
Name in quotes.
Example: laneMarking('Dashed','Width',0.25,'Length',5.0) creates a
lane with dashes that are 0.25 meters wide and spaced 5 meters apart.
Lane marking widths, specified as the comma-separated pair consisting of
'Width' and a positive real scalar. For a double lane marker, the
same width is used for both lines. Units are in meters.
The width of the lane marking must be less than the width of its enclosing lane. The enclosing lane is the lane directly to the left of the lane marking.
Example: 0.20
Color of lane marking, specified as the comma-separated pair consisting of
'Color' and an RGB triplet, a hexadecimal color code, a color
name, or a short color name. For a double lane marker, the same color is used for both
lines.
For a custom color, specify an RGB triplet or a hexadecimal color code.
An RGB triplet is a three-element row vector whose elements specify the intensities of the red, green, and blue components of the color. The intensities must be in the range
[0,1], for example,[0.4 0.6 0.7].A hexadecimal color code is a string scalar or character vector that starts with a hash symbol (
#) followed by three or six hexadecimal digits, which can range from0toF. The values are not case sensitive. Therefore, the color codes"#FF8800","#ff8800","#F80", and"#f80"are equivalent.
Alternatively, you can specify some common colors by name. This table lists the named color options, the equivalent RGB triplets, and the hexadecimal color codes.
| Color Name | Short Name | RGB Triplet | Hexadecimal Color Code | Appearance |
|---|---|---|---|---|
'red' | 'r' | [1 0 0] | '#FF0000' |
|
'green' | 'g' | [0 1 0] | '#00FF00' |
|
'blue' | 'b' | [0 0 1] | '#0000FF' |
|
'cyan'
| 'c' | [0 1 1] | '#00FFFF' |
|
'magenta' | 'm' | [1 0 1] | '#FF00FF' |
|
'yellow' | 'y' | [0.98 0.86 0.36] | '#FADB5C' |
|
'black' | 'k' | [0 0 0] | '#000000' |
|
'white' | 'w' | [1 1 1] | '#FFFFFF' |
|
Example: [0.8 0.8 0.8]
Saturation strength of lane marking color, specified as the comma-separated pair
consisting of 'Strength' and a real scalar in the range [0, 1]. A
value of 0 corresponds to a marking whose color is fully
unsaturated. The marking is gray. A value of 1 corresponds to a
marking whose color is fully saturated. For a double lane marking, the same strength
is used for both lines.
Example: 0.20
Length of dash in dashed lines, specified as the comma-separated pair consisting
of 'Length' and a positive real scalar. For a double lane marking,
the same length is used for both lines. The dash is the visible part of a dashed line.
Units are in meters.
Example: 2.0
Length of space between the end of one dash and the beginning of the next dash,
specified as the comma-separated pair consisting of 'Space' and a
positive real scalar. For a double lane marking, the same length is used for both
lines. Units are in meters.
Example: 2.0
Output Arguments
More About
To create a road by using the road function, specify the road centers as a
matrix input. The function creates a directed line that traverses the road centers, starting
from the coordinates in the first row of the matrix and ending at the coordinates in the last
row of the matrix. The coordinates in the first two rows of the matrix specify the
draw direction of the road. These coordinates correspond to the first
two consecutive road centers. The draw direction is the direction in which the roads render in
the scenario plot.
To create a road by using the Driving Scenario Designer app, you can either specify the Road Centers parameter or interactively draw on the Scenario Canvas. For a detailed example, see Create a Driving Scenario. In this case, the draw direction is the direction in which roads render in the Scenario Canvas.
For a road with a top-to-bottom draw direction, the difference between the x-coordinates of the first two consecutive road centers is positive.
For a road with a bottom-to-top draw direction, the difference between the x-coordinates of the first two consecutive road centers is negative.
|
|
|

For a road with a left-to-right draw direction, the difference between the y-coordinates of the first two consecutive road centers is positive.
For a road with a right-to-left draw direction, the difference between the y-coordinates of the first two consecutive road centers is negative.
|
|
|


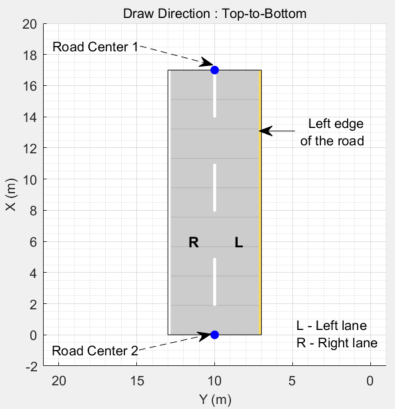
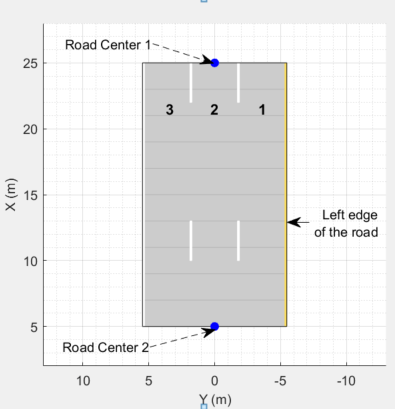
Lanes must be numbered from left to right, with the left edge of the road defined relative to the draw direction of the road. For a one-way road, by default, the left edge of the road is a solid yellow marking which indicates the end of the road in transverse direction (direction perpendicular to draw direction). For a two-way road, by default, both edges are marked with solid white lines.
For example, these diagrams show how the lanes are numbered in a one-way and two-way road with a draw direction from top-to-bottom.
| Numbering Lanes in a One-Way Road | Numbering Lanes in a Two-Way Road |
Specify the number of lanes as a positive integer for a one-way road. If
you set the integer value as 1, 2, 3 denote the first, second, and third lanes of the road, respectively.
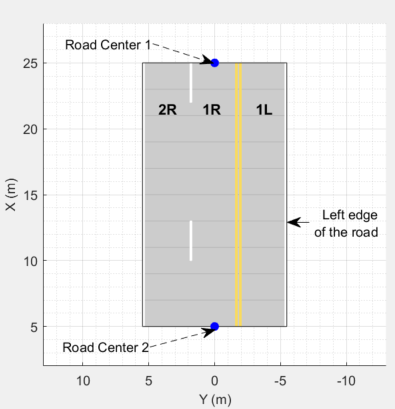
| Specify the number of lanes as a two-element vector of positive integer
for a two-way road. If you set the vector as [ 1L denote the only left lane of the road. 1R and 2R denote the first and second right lanes of the road, respectively.
|
The lane specifications apply by the order in which the lanes are numbered.
A composite lane marking comprises two or more marker segments that define multiple marking types along a lane. The geometric properties for a composite lane marking include the geometric properties of each marking type and the normalized lengths of the marker segments.
The order in which the specified marker segments occur in a composite lane
marking depends on the draw direction of the road. Each marker segment is a directed
segment with a start point and moves towards the last road center. The first marker
segment starts from the first road center and moves towards the last road center for a
specified length. The second marker segment starts from the end point of the first
marker segment and moves towards the last road center for a specified length. The same
process applies for each marker segment that you specify for the composite lane marking.
You can set the normalized length for each of these marker segments by specifying the
range input argument.
For example, consider a one-way road with two lanes. The second lane marking
from the left edge of the road is a composite lane marking with marking types
Solid and Dashed. The normalized range for
each marking type is 0.5. The first marker segment is a solid marking and the second
marker segment is a dashed marking. These diagrams show the order in which the marker
segments apply for left-to-right and right-to-left draw directions of the road.
|
|
|
For information on the geometric properties of lane markings, see Lane Specifications.
The diagram shows the components and geometric properties of roads, lanes, and lane markings.

The lane specification object, lanespec, defines the road lanes.
The
NumLanesproperty specifies the number of lanes. You must specify the number of lanes when you create this object.The
Widthproperty specifies the width of each lane.The
Markingproperty contains the specifications of each lane marking in the road.Markingis an array of lane marking objects, with one object per lane. To create these objects, use thelaneMarkingfunction. Lane marking specifications include:Type— Type of lane marking (solid, dashed, and so on)Width— Lane marking widthColor— Lane marking colorStrength— Saturation value for lane marking colorLength— For dashed lanes, the length of each dashed lineSpace— For dashed lanes, the spacing between dashesSegmentRange— For composite lane marking, the normalized length of each marker segment
The
Typeproperty contains the lane type specifications of each lane in the road.Typecan be a homogeneous lane type object or a heterogeneous lane type array.Homogeneous lane type object contains the lane type specifications of all the lanes in the road.
Heterogeneous lane type array contains an array of lane type objects, with one object per lane.
To create these objects, use the
laneTypefunction. Lane type specifications include:Type— Type of lane (driving, border, and so on)Color— Lane colorStrength— Strength of the lane color
Version History
Introduced in R2018a