lagmatrix
Create lagged time series data
Syntax
Description
shifts all variables in the input table or timetable, which represent regular time series,
and returns a table or timetable of shifted series. To select different variables to shift,
use the LagTbl = lagmatrix(Tbl,lags)DataVariables name-value argument. (since R2022a)
[___] = lagmatrix(___,
specifies options using one or more name-value arguments in
addition to any of the input argument combinations in previous syntaxes.
Name=Value)lagmatrix returns the output argument combination for the
corresponding input arguments. For example,
lagmatrix(Tbl,1,Y0=zeros(1,5),DataVariables=1:5) lags, by one period,
the first five variables in the input table Tbl and sets the presample
of each series to 0.
Examples
Create a bivariate time series matrix X with five observations each.
Y = [1 -1; 2 -2 ;3 -3 ;4 -4 ;5 -5]
Y = 5×2
1 -1
2 -2
3 -3
4 -4
5 -5
Create a shifted matrix, which is composed of the original X and its first two lags.
lags = [0 1 2]; XLag = lagmatrix(Y,lags)
XLag = 5×6
1 -1 NaN NaN NaN NaN
2 -2 1 -1 NaN NaN
3 -3 2 -2 1 -1
4 -4 3 -3 2 -2
5 -5 4 -4 3 -3
XLAG is a 5-by-6 matrix:
The first two columns contain the original data (lag 0).
Columns 3 and 4 contain the data lagged by one unit.
Columns 5 and 6 contain the data lagged by two units.
By default, lagmatrix returns only values corresponding to the time base of the original data, and the function fills unknown presample values using NaNs.
Create a bivariate time series matrix X with five observations each.
Y = [1 -1; 2 -2 ;3 -3 ;4 -4 ;5 -5]
Y = 5×2
1 -1
2 -2
3 -3
4 -4
5 -5
Create a shifted matrix, which is composed of the original X and its first two lags. Return the time base of the shift series.
lags = [0 1 2]; [XLag,TLag] = lagmatrix(Y,lags);
By default, lagmatrix returns the time base of the input data.
Since R2022a
Shift multiple time series, which are variables in tables, using the default options of lagmatrix.
Load data of yearly Canadian inflation and interest rates Data_Canada.mat, which contains five series in the table DataTable.
load Data_CanadaCreate a timetable from the table of data.
dates = datetime(dates,12,31); TT = table2timetable(DataTable,RowTimes=dates); TT.Observations = []; tail(TT)
Time INF_C INF_G INT_S INT_M INT_L
___________ _______ _______ ______ ______ ______
31-Dec-1987 4.2723 4.608 8.1692 9.4158 9.9267
31-Dec-1988 3.9439 4.5256 9.4158 9.7717 10.227
31-Dec-1989 4.8743 4.7258 12.016 10.203 9.9217
31-Dec-1990 4.6547 3.1015 12.805 11.193 10.812
31-Dec-1991 5.4633 2.8614 8.8301 9.1625 9.8067
31-Dec-1992 1.4946 1.2281 6.5088 7.4317 8.7717
31-Dec-1993 1.8246 1.0473 4.9268 6.4583 7.8767
31-Dec-1994 0.18511 0.60929 5.4168 7.7867 8.58
Create timetable containing all series lagged by one year, the series themselves, and the series led by a year.
lags = [1 0 -1]; LagTT = lagmatrix(TT,lags); head(LagTT)
Time Lag1INF_C Lag1INF_G Lag1INT_S Lag1INT_M Lag1INT_L Lag0INF_C Lag0INF_G Lag0INT_S Lag0INT_M Lag0INT_L Lead1INF_C Lead1INF_G Lead1INT_S Lead1INT_M Lead1INT_L
___________ _________ _________ _________ _________ _________ _________ _________ _________ _________ _________ __________ __________ __________ __________ __________
31-Dec-1954 NaN NaN NaN NaN NaN 0.6606 1.4468 1.4658 2.6683 3.255 0.077402 0.76162 1.5533 2.7908 3.1892
31-Dec-1955 0.6606 1.4468 1.4658 2.6683 3.255 0.077402 0.76162 1.5533 2.7908 3.1892 1.4218 3.0433 2.9025 3.7575 3.6058
31-Dec-1956 0.077402 0.76162 1.5533 2.7908 3.1892 1.4218 3.0433 2.9025 3.7575 3.6058 3.1546 2.3148 3.7775 4.565 4.125
31-Dec-1957 1.4218 3.0433 2.9025 3.7575 3.6058 3.1546 2.3148 3.7775 4.565 4.125 2.4828 1.3636 2.2925 3.4692 4.115
31-Dec-1958 3.1546 2.3148 3.7775 4.565 4.125 2.4828 1.3636 2.2925 3.4692 4.115 1.183 2.0722 4.805 4.9383 5.0492
31-Dec-1959 2.4828 1.3636 2.2925 3.4692 4.115 1.183 2.0722 4.805 4.9383 5.0492 1.2396 1.2139 3.3242 4.5192 5.1892
31-Dec-1960 1.183 2.0722 4.805 4.9383 5.0492 1.2396 1.2139 3.3242 4.5192 5.1892 1.0156 0.46074 2.8342 4.375 5.0583
31-Dec-1961 1.2396 1.2139 3.3242 4.5192 5.1892 1.0156 0.46074 2.8342 4.375 5.0583 1.1088 1.3737 4.0125 4.6 5.1008
LagTT is a timetable containing the shifted series. lagmatrix appends each variable of the input timetable by Lagj or Leadj, depending on whether the series is a lag or lead, with j indicating the number of shifting units.
By default, lagmatrix shifts all variables in the input table. You can choose a subset of variables to shift by using the DataVariables name-value argument. For example, shift only the inflation rate series.
LagTTINF = lagmatrix(TT,lags,DataVariables=["INF_C" "INF_G"]); head(LagTTINF)
Time Lag1INF_C Lag1INF_G Lag0INF_C Lag0INF_G Lead1INF_C Lead1INF_G
___________ _________ _________ _________ _________ __________ __________
31-Dec-1954 NaN NaN 0.6606 1.4468 0.077402 0.76162
31-Dec-1955 0.6606 1.4468 0.077402 0.76162 1.4218 3.0433
31-Dec-1956 0.077402 0.76162 1.4218 3.0433 3.1546 2.3148
31-Dec-1957 1.4218 3.0433 3.1546 2.3148 2.4828 1.3636
31-Dec-1958 3.1546 2.3148 2.4828 1.3636 1.183 2.0722
31-Dec-1959 2.4828 1.3636 1.183 2.0722 1.2396 1.2139
31-Dec-1960 1.183 2.0722 1.2396 1.2139 1.0156 0.46074
31-Dec-1961 1.2396 1.2139 1.0156 0.46074 1.1088 1.3737
Create a vector of univariate time series data.
y = [0.1 0.4 -0.2 0.1 0.2]';
Create vectors representing presample and postsample data.
y0 = [0.50; 0.75]*y(1)
y0 = 2×1
0.0500
0.0750
yF = [0.75; 0.50]*y(end)
yF = 2×1
0.1500
0.1000
Shift the series by two units in both directions. Specify the presample and postsample data, and return a matrix containing shifted series for the entire time base.
lags = [2 0 -2]; [YLag,TLag] = lagmatrix(y,lags,Y0=y0,YF=yF)
YLag = 5×3
0.0500 0.1000 -0.2000
0.0750 0.4000 0.1000
0.1000 -0.2000 0.2000
0.4000 0.1000 0.1500
-0.2000 0.2000 0.1000
TLag = 5×1
1
2
3
4
5
Because the presample and postsample have enough observations to cover the time base of the input data, the shifted series YLag is completely specified (it does not contain NaN entries).
Shift the series in the same way, but return a matrix containing shifted series for the entire time base by specifying "full" for the Shape name-value argument.
[YLagFull,TLagFull] = lagmatrix(y,lags,Y0=y0,YF=yF,Shape="full")YLagFull = 9×3
NaN 0.0500 0.1000
NaN 0.0750 0.4000
0.0500 0.1000 -0.2000
0.0750 0.4000 0.1000
0.1000 -0.2000 0.2000
0.4000 0.1000 0.1500
-0.2000 0.2000 0.1000
0.1000 0.1500 NaN
0.2000 0.1000 NaN
TLagFull = 9×1
-1
0
1
2
3
4
5
6
7
Because the presample and postsample do not contain enough observations to cover the full time base, which includes presample through postsample times, lagmatrix fills unknown sample units using NaN values.
Input Arguments
Time series data, specified as a numObs-by-numVars
numeric matrix. Each column of Y corresponds to a variable, and
each row corresponds to an observation.
Data Types: double
Data shifts, specified as an integer or integer-valued vector of length
numShifts.
Lags are positive integers, which shift the input series forward over the time base.
Leads are negative integers, which shift the input series backward over the time base.
lagmatrix applies each specified shift in
lags, in order, to each input series.
Shifts of regular time series have units of one time step.
Data Types: double
Time series data, specified as a table or timetable with numObs
rows. Each row of Tbl is an observation.
If Tbl is a timetable, it must represent a sample with a
regular datetime time step (see isregular).
Specify numVars variables to filter by using the
DataVariables argument. The selected variables must be
numeric.
Name-Value Arguments
Specify optional pairs of arguments as
Name1=Value1,...,NameN=ValueN, where Name is
the argument name and Value is the corresponding value.
Name-value arguments must appear after other arguments, but the order of the
pairs does not matter.
Before R2021a, use commas to separate each name and value, and enclose
Name in quotes.
Example: lagmatrix(Tbl,1,Y0=zeros(1,5),DataVariables=1:5) lags, by one
period, the first 5 variables in the input table Tbl and sets the
presample of each series to 0.
Since R2022a
Presample data to backward fill lagged series, specified as a matrix with
numVars columns, or a table or timetable. For a table or
timetable, the DataVariables name-value argument selects the
variables in Y0 to shift.
Y0 must have the same data type as the input data.
Timetables must have regular sample times preceding times in
Tbl.
lagmatrix fills required presample values from the end of
Y0.
Example: Y0=zeros(size(Y,2),2)
Since R2022a
Postsample data to frontward fill led series, specified as a matrix with
numVars columns, or a table or timetable. For a table or
timetable, the DataVariables name-value argument selects the
variables in YF to shift. The default for postsample data is
NaN.
YF must have the same data type as the input data.
Timetables must have regular sample times following times in
Tbl.
lagmatrix fills required postsample values from the
beginning of YF.
Example: YF=ones(size(Y,2),3)
Since R2022a
Variables in Tbl, Y0, and
YF, from which lagmatrix creates shifted
time series data, specified as a string vector or cell vector of character vectors
containing variable names in Tbl.Properties.VariableNames, or an
integer or logical vector representing the indices of names. The selected variables
must be numeric.
Example: DataVariables=["GDP" "CPI"]
Example: DataVariables=[true true false false] or
DataVariables=[1 2] selects the first and second table
variables.
Data Types: double | logical | char | cell | string
Since R2022a
Part of the shifted series to appear in the outputs, specified as a value in this table.
| Value | Description |
|---|---|
"full" | Outputs contain all values in the input time series data and all
specified presample Y0 or postsample
Yf values on an expanded time base. |
"same" | Outputs contain only values on the original time base. |
"valid" | Outputs contain values for times at which all series have specified
(non-NaN) values. |
To illustrate the shape of the output shifted time series for each
value of Shape, suppose the input time series data is a 2-D
series with numObs = T observations and lags is [1 0 -1]. The
output shifted series is one of the three T-by-6 matrix arrays in
this figure.
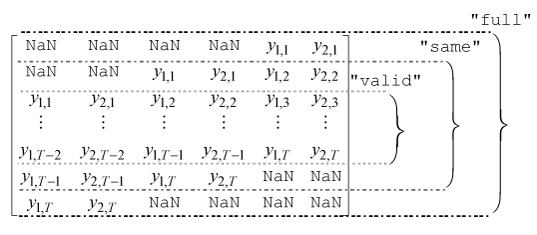
Example: Shape="full"
Data Types: char | string
Output Arguments
Shifted time series variables in Y, returned as a numeric
matrix. lagmatrix returns YLag when you
supply the input Y.
Columns are, in order, all series in Y shifted by the
lags(1), all series in Y shifted by the
lags(2), …, all series in Y shifted by
lags(end). Rows depend on the value of the
Shape name-value argument.
For example, suppose Y is the 2-D time series of
numObs = T observations
lags is [1 0 -1], and Shape
if "full". YLag is the T-by-6 matrix
Common time base for the shifted series relative to the original time base of
1, 2, 3, …,
numObs, returned as a vector of length equal to the number of
observations in YLag. lagmatrix returns
TLag when you supply the input Y.
Series with lags (lags > 0) have higher indices; series with
leads (lags < 0) have lower indices. For example, the value of
TLag for the example in the YLag output
description is the column vector with entries 0:(T+1).
Since R2022a
Shifted time series variables and common time base, returned as a table or
timetable, the same data type as Tbl.
lagmatrix returns LagTbl when you supply
the input Tbl.
LagTbl contains the outputs YLag and
TLag. The following conditions apply:
Each lagged variable of
LagTblhas a labelLag, wherejvarnameis the corresponding variable name invarnameDataVariablesandis lagjinjlags.Each lead variable has a label
Lead, wherejvarnameis leadjinjlags.If
LagTblis a table, the variable labeledTLagcontainsTLag.If
LagTblis a timetable, theTimevariable containsTLag.
Version History
Introduced before R2006aIn addition to accepting input data in numeric arrays,
lagmatrix accepts input data in tables and timetables. To choose which variables from the input table or timetable to lag, specify
the DataVariables name-value argument.
In addition to supporting input data in a table or timetable,
lagmatrix enables you to optionally specify the following values by
using name-value argument syntax:
Y0— Presample data, specified as a matrix, table, or timetableYF— Postsample data, specified as a matrix, table, or timetableShape— Output shape specifying which part of the shifted series to return.
Also, lagmatrix returns the time base defined by the value of
Shape, either in the second output position when you specify numeric
data or as a variable in the output table when you specify data in a table or
timetable.
See Also
Functions
Objects
MATLAB Command
You clicked a link that corresponds to this MATLAB command:
Run the command by entering it in the MATLAB Command Window. Web browsers do not support MATLAB commands.
Sélectionner un site web
Choisissez un site web pour accéder au contenu traduit dans votre langue (lorsqu'il est disponible) et voir les événements et les offres locales. D’après votre position, nous vous recommandons de sélectionner la région suivante : .
Vous pouvez également sélectionner un site web dans la liste suivante :
Comment optimiser les performances du site
Pour optimiser les performances du site, sélectionnez la région Chine (en chinois ou en anglais). Les sites de MathWorks pour les autres pays ne sont pas optimisés pour les visites provenant de votre région.
Amériques
- América Latina (Español)
- Canada (English)
- United States (English)
Europe
- Belgium (English)
- Denmark (English)
- Deutschland (Deutsch)
- España (Español)
- Finland (English)
- France (Français)
- Ireland (English)
- Italia (Italiano)
- Luxembourg (English)
- Netherlands (English)
- Norway (English)
- Österreich (Deutsch)
- Portugal (English)
- Sweden (English)
- Switzerland
- United Kingdom (English)