threshold
Description
threshold creates threshold transitions from the specified levels and
transition type, either discrete or smooth. Use a threshold object to specify
the switching mechanism of a threshold-switching dynamic regression model (tsVAR).
To study a threshold transitions model, pass a fully specified threshold
object to an object function. You can specify
transition levels and rates as unknown parameters (NaN values), which you
can estimate when you fit a tsVAR model to data by using estimate.
Alternatively, to create a random switching mechanism, governed by a discrete-time Markov
chain, for a Markov-switching dynamic regression model, see dtmc and msVAR.
Creation
Description
tt = threshold(levels)tt for discrete state transitions specified by
the transition mid-levels levels.
tt = threshold(levels,Name,Value)threshold([0
1],Type="exponential",Rates=[0.5 1.5]) specifies smooth, exponential
transitions at mid-levels 0 and 1 with rates
0.5 and 1.5, respectively.
Input Arguments
Properties
Object Functions
Examples
Create a threshold transition at mid-level .
t1 = 0;
tt = threshold(t1)
tt =
  threshold with properties:

          Type: 'discrete'
        Levels: 0
         Rates: []
    StateNames: ["1"    "2"]
     NumStates: 2
tt is a threshold object representing a discrete threshold transition at mid-level 0. tt is fully specified because its properties do not contain NaN values. Therefore, you can pass tt to any threshold object function.
Given a univariate threshold variable, tt divides the range of the variable into two distinct states, which tt labels "1" and "2". tt also specifies the switching mechanism of a threshold-switching autoregressive (TAR) model, represented by a tsVAR object. Given values of the observed univariate transition variable:
The TAR model is in state
"1"when the transition variable is in the interval .The TAR model is in state
"2"when the transition variable is in the interval .
This example shows how to create two logistic threshold transitions with different transition rates, and then display a gradient plot of the transitions.
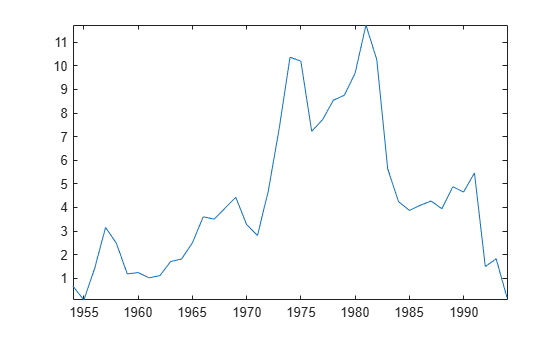
Load the yearly Canadian inflation and interest rates data set. Extract the inflation rate based on consumer price index (INF_C) from the table, and plot the series.
load Data_Canada
INF_C = DataTable.INF_C;

plot(dates,INF_C);
axis tight
Assume the following characteristics of the inflation rate series:
Rates below 2% are low.
Rates at least 2% and below 8% are medium.
Rates at least 8% are high.
A logistic transition function describes the transition between states well.
Transition between low and medium rates are faster than transitions between medium and high.
Create threshold transitions to describe the Canadian inflation rates.
t = [2 8];      % Thresholds
r = [3.5 1.5];  % Transition rates
statenames = ["Low" "Med" "High"];
tt = threshold(t,Type="logistic",Rates=r,StateNames=statenames)
tt =
  threshold with properties:

          Type: 'logistic'
        Levels: [2 8]
         Rates: [3.5000 1.5000]
    StateNames: ["Low"    "Med"    "High"]
     NumStates: 3
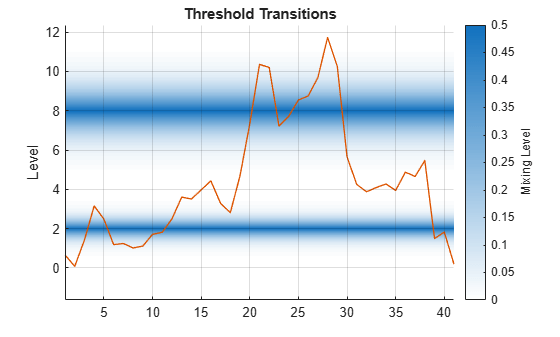
Plot the threshold transitions; show the gradient of the transition function between the states, and overlay the data.
figure
ttplot(tt,Data=INF_C)
A threshold-switching dynamic regression (tsVAR) model has two main components:
Threshold transitions, which represent the switching mechanism between states. Mid-levels and transition rates are estimable.
A collection of autoregressive models describing the dynamic system among states. Submodel coefficients and covariances are estimable.
Before you create a threshold-switching model, you must specify its threshold transitions by using theshold. If you plan to fit a threshold-switching model to data, you can fully specify its threshold transitions if you know all mid-levels and transition rates. If you need to estimate some or all mid-levels and rates, you can enter NaN values as placeholders for unknown parameters. estimate treats all specified parameters as equality constraints during estimation. Regardless, to fit threshold transition parameters to data, you must specify a partially specified threshold object as the switching mechanism of a threshold-switching model.
Prepare All Estimable Parameters for Estimation
Consider a smooth transition autoregressive (STAR) model that switches between three states (two thresholds) with an exponential transition function.
Create the switching mechanism. Specify that all estimable parameters are unknown.
t1 = [NaN NaN]; % Two unknown mid-levels
r1 = [NaN NaN]; % Two unknown transition rates
tt1 = threshold(t1,Type="exponential",Rates=r1)
tt1 =
  threshold with properties:

          Type: 'exponential'
        Levels: [NaN NaN]
         Rates: [NaN NaN]
    StateNames: ["1"    "2"    "3"]
     NumStates: 3
tt is a partially specified threshold object to pass to tsVAR as the switching mechanism. The estimate function of tsVAR fits the two mid-levels and transition rates to the data with any unknown submodel parameters in the threshold-switching model.
Specify Equality Constraints
Consider a STAR model, which has a switching mechanism with the following qualities:
The thresholds are at -1 and 1.
The transition function is exponential.
The transition rate between the first and second state is 0.5, but the rate between the second and third states is unknown.
Create the switching mechanism.
t2 = [-1 1];
r2 = [0.5 NaN];
tt2 = threshold(t2,Type="exponential",Rates=r2)
tt2 =
threshold with properties:
Type: 'exponential'
Levels: [-1 1]
Rates: [0.5000 NaN]
StateNames: ["1" "2" "3"]
NumStates: 3
tt is a partially specified threshold object to pass to tsVAR as the switching mechanism. The estimate function of tsVAR does the following:
Treat the mid-levels
tt.Levelsand the first transition ratett.Rates(1)as equality constraintsFit the second transition rate
tt.Rates(2)to the data with any unknown submodel parameters in the threshold-switching model
Create smooth threshold transitions with the following qualities:
Mid-levels are at -1, 1, and 2.
The transition function is the Student's cdf, which allows for a more gradual mixing than the normal cdf.
The transition rates, which are the degrees of freedom of the distribution, are 3, 10, and 100.
t = [-1 1 2];
r = [3 10 100];
ttransfcn = @(z,ti,ri)tcdf(z,ri);
tt = threshold(t,Type="custom",TransitionFunction=ttransfcn,Rates=r)
tt =
threshold with properties:
Type: 'custom'
Levels: [-1 1 2]
Rates: [3 10 100]
StateNames: ["1" "2" "3" "4"]
NumStates: 4
Plot graphs of each transition function.
figure
ttplot(tt,Type="graph")
legend(string(tt.Levels))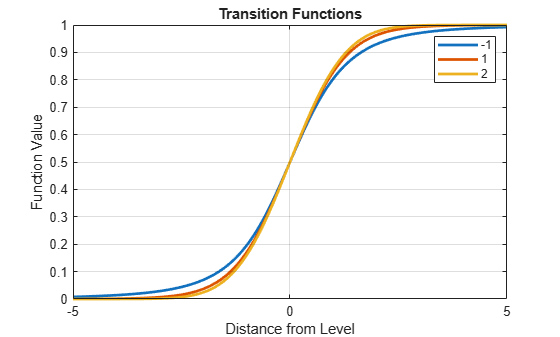
More About
Tips
To widen a smooth transition band to show a more gradual mixing of states, decrease the transition rate by specifying the
Ratesname-value argument when you create threshold transitions.
References
Version History
Introduced in R2021b